29
/
en
AIzaSyAYiBZKx7MnpbEhh9jyipgxe19OcubqV5w
April 1, 2024
78925
Bangladesh
BGD
true
2
1
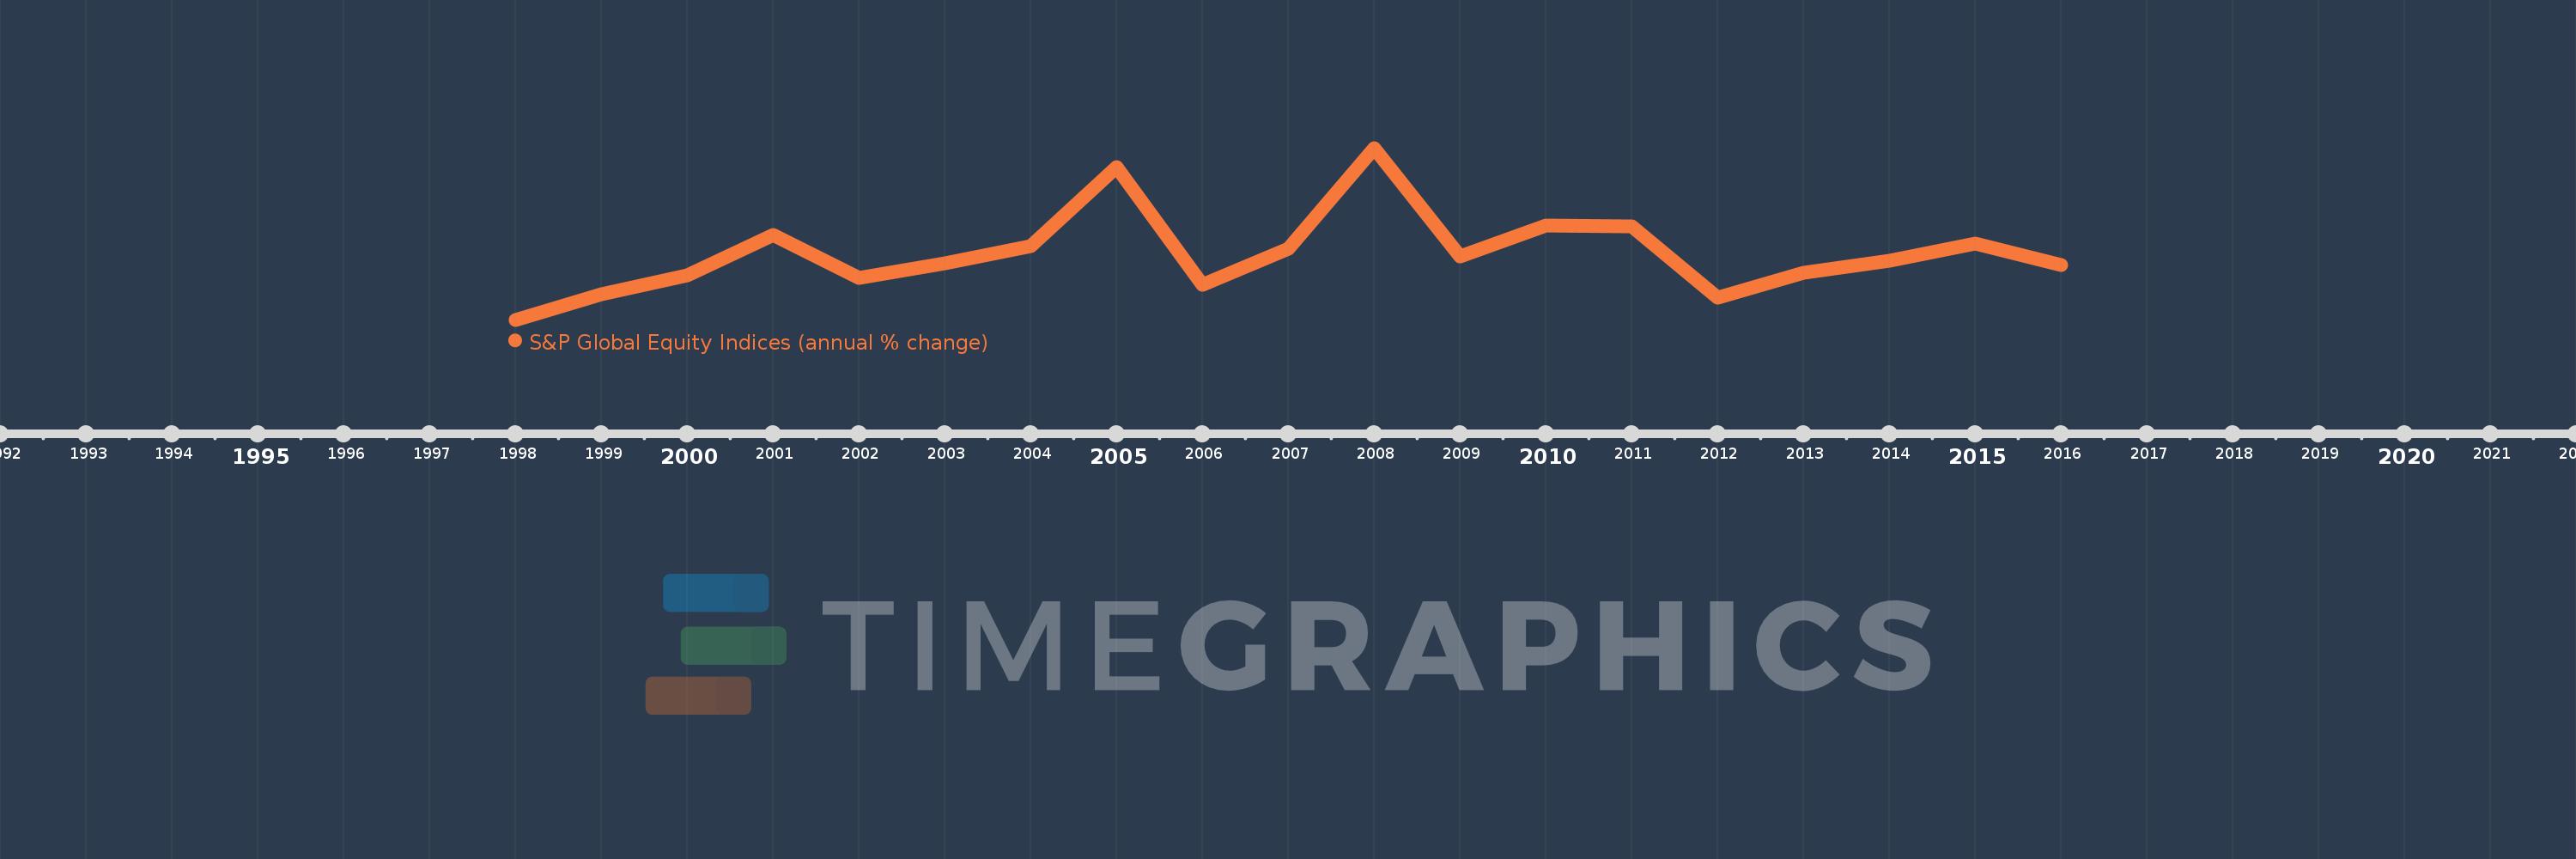
S&P Global Equity Indices (annual % change)
2016,2015,2014,2013,2012,2011,2010,2009,2008,2007,2006,2005,2004,2003,2002,2001,2000,1999,1998
This statistics in other country:
Timeline:
This timeline shows a graph from 1998 to 2016 of Bangladesh. No data until 1997. Number of actual observations by date: 19.
Source name:
World Development Indicators
Source organization:
Standard & Poor's, Global Stock Markets Factbook and supplemental S&P data.
Categories, topics:
Financial Sector
Last updated:
apr 23, 2017
Indicators value changes by year
Minimum:
-67.66
jan 1, 1998
Maximum:
126.391
jan 1, 2008
At the date of observation
Value
Absolute change
Change from previous value
jan 1, 1998
-67.66
-67.66
0.0%
jan 1, 1999
-38.479
+29.181
-43.13%
jan 1, 2000
-17.5
+20.979
-54.52%
jan 1, 2001
28.487
+45.987
-262.79%
jan 1, 2002
-20.672
-49.16
-172.57%
jan 1, 2003
-4.24
+16.432
-79.49%
jan 1, 2004
15.37
+19.61
-462.5%
jan 1, 2005
104.3
+88.93
578.59%
jan 1, 2006
-27.749
-132.049
-126.61%
jan 1, 2007
12.855
+40.605
-146.33%
jan 1, 2008
126.391
+113.536
883.19%
jan 1, 2009
4.253
-122.138
-96.63%
jan 1, 2010
38.637
+34.384
808.38%
jan 1, 2011
37.642
-0.995
-2.58%
jan 1, 2012
-42.308
-79.95
-212.4%
jan 1, 2013
-14.32
+27.988
-66.15%
jan 1, 2014
-1.377
+12.944
-90.39%
jan 1, 2015
18.541
+19.918
-1.45K%
jan 1, 2016
-5.376
-23.918
-129.0%
Ranking of countries by current statistics by years


Comments: