29
/
en
AIzaSyAYiBZKx7MnpbEhh9jyipgxe19OcubqV5w
April 1, 2024
77592
Bahrain
BHR
true
2
1
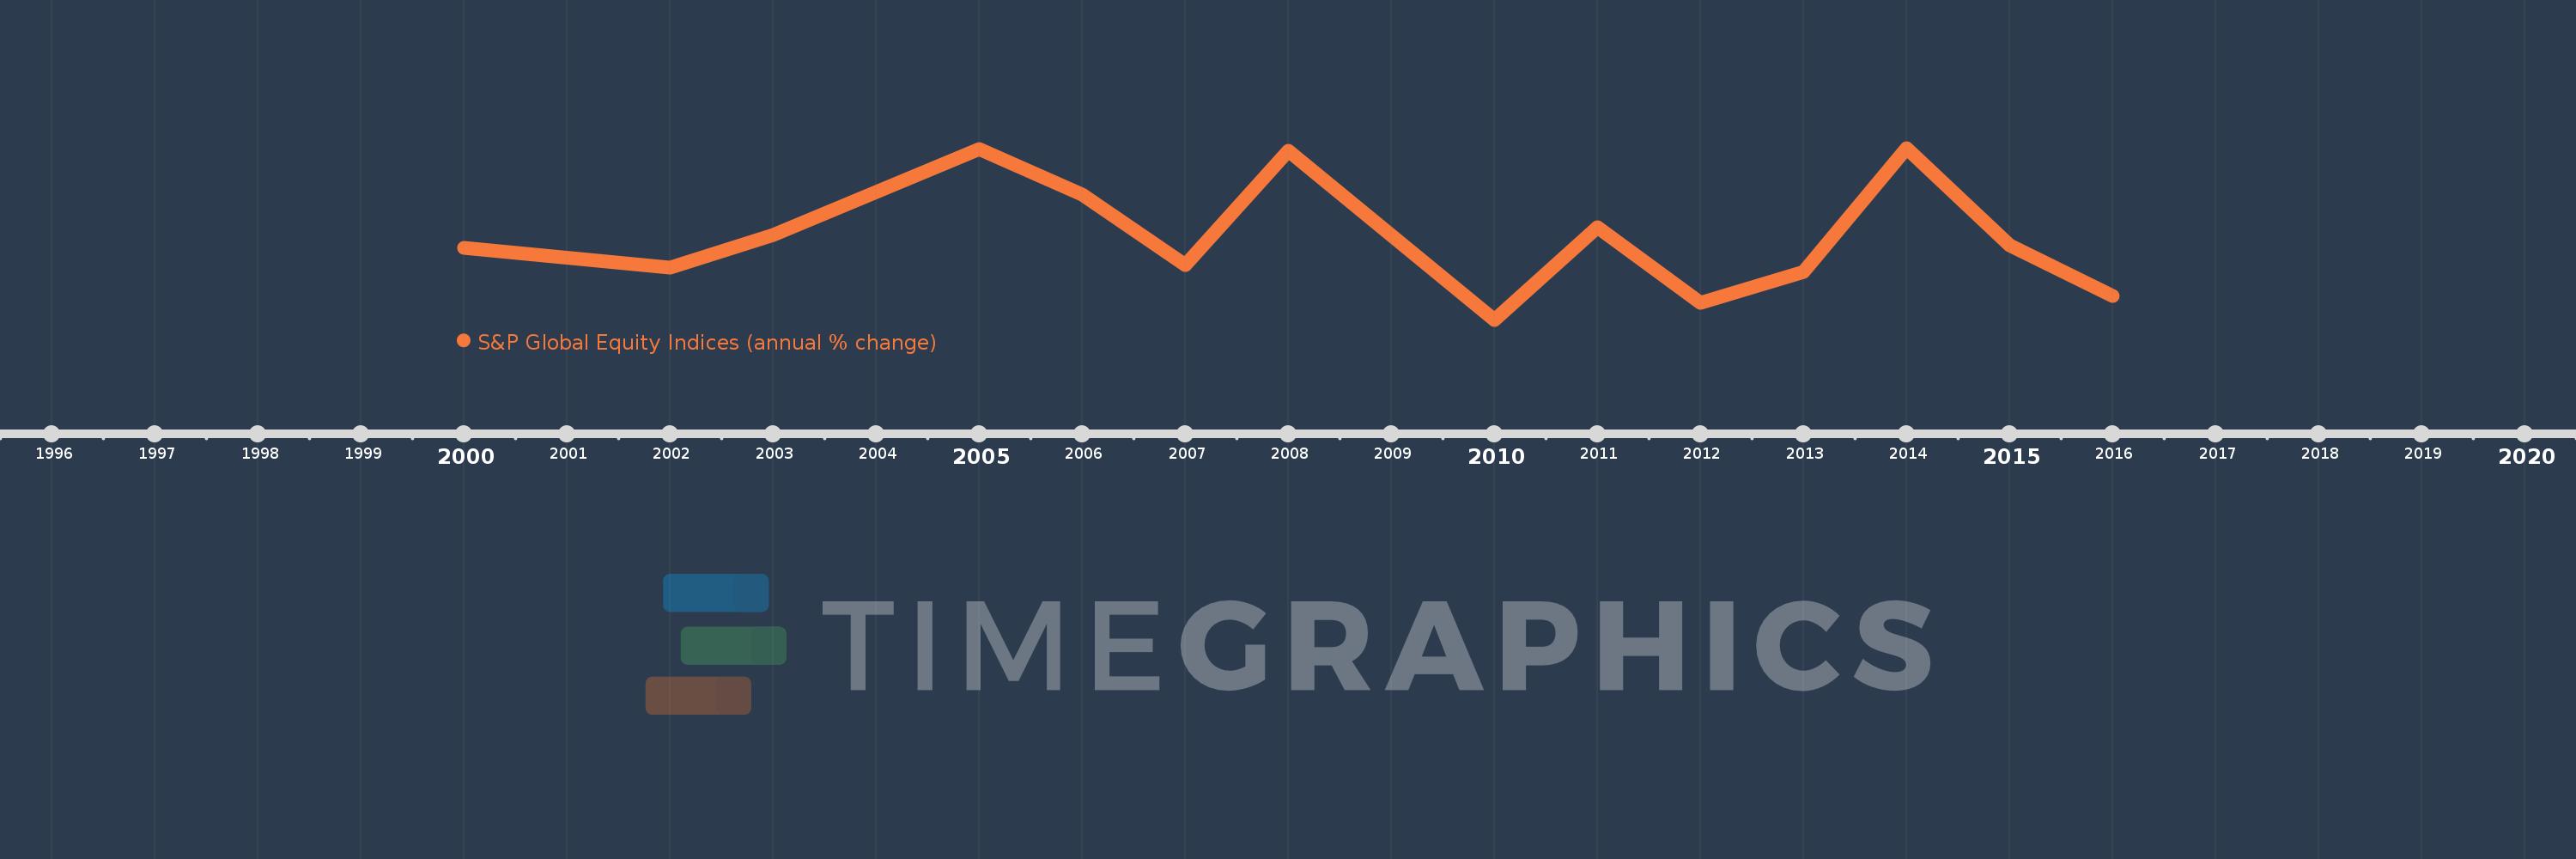
S&P Global Equity Indices (annual % change)
2016,2015,2014,2013,2012,2011,2010,2008,2007,2006,2005,2003,2002,2000
This statistics in other country:
Timeline:
This timeline shows a graph from 2000 to 2016 of Bahrain. No data until 1999. Number of actual observations by date: 14.
Source name:
World Development Indicators
Source organization:
Standard & Poor's, Global Stock Markets Factbook and supplemental S&P data.
Categories, topics:
Financial Sector
Last updated:
apr 23, 2017
Indicators value changes by year
Minimum:
-19.969
jan 1, 2010
Maximum:
35.831
jan 1, 2014
At the date of observation
Value
Absolute change
Change from previous value
jan 1, 2002
-2.925
-6.425
-183.56%
jan 1, 2003
7.44
+10.365
-354.39%
jan 1, 2005
35.4
+27.96
375.81%
jan 1, 2006
20.801
-14.599
-41.24%
jan 1, 2007
-2.244
-23.045
-110.79%
jan 1, 2008
34.991
+37.235
-1.66K%
jan 1, 2010
-19.969
-54.959
-157.07%
jan 1, 2011
9.968
+29.937
-149.92%
jan 1, 2012
-14.368
-24.336
-244.15%
jan 1, 2013
-4.475
+9.894
-68.86%
jan 1, 2014
35.831
+40.306
-900.73%
jan 1, 2015
4.126
-31.706
-88.49%
jan 1, 2016
-12.341
-16.467
-399.12%
Ranking of countries by current statistics by years


Comments: