29
/
en
AIzaSyAYiBZKx7MnpbEhh9jyipgxe19OcubqV5w
April 1, 2024
220296
Papua New Guinea
PNG
true
2
1
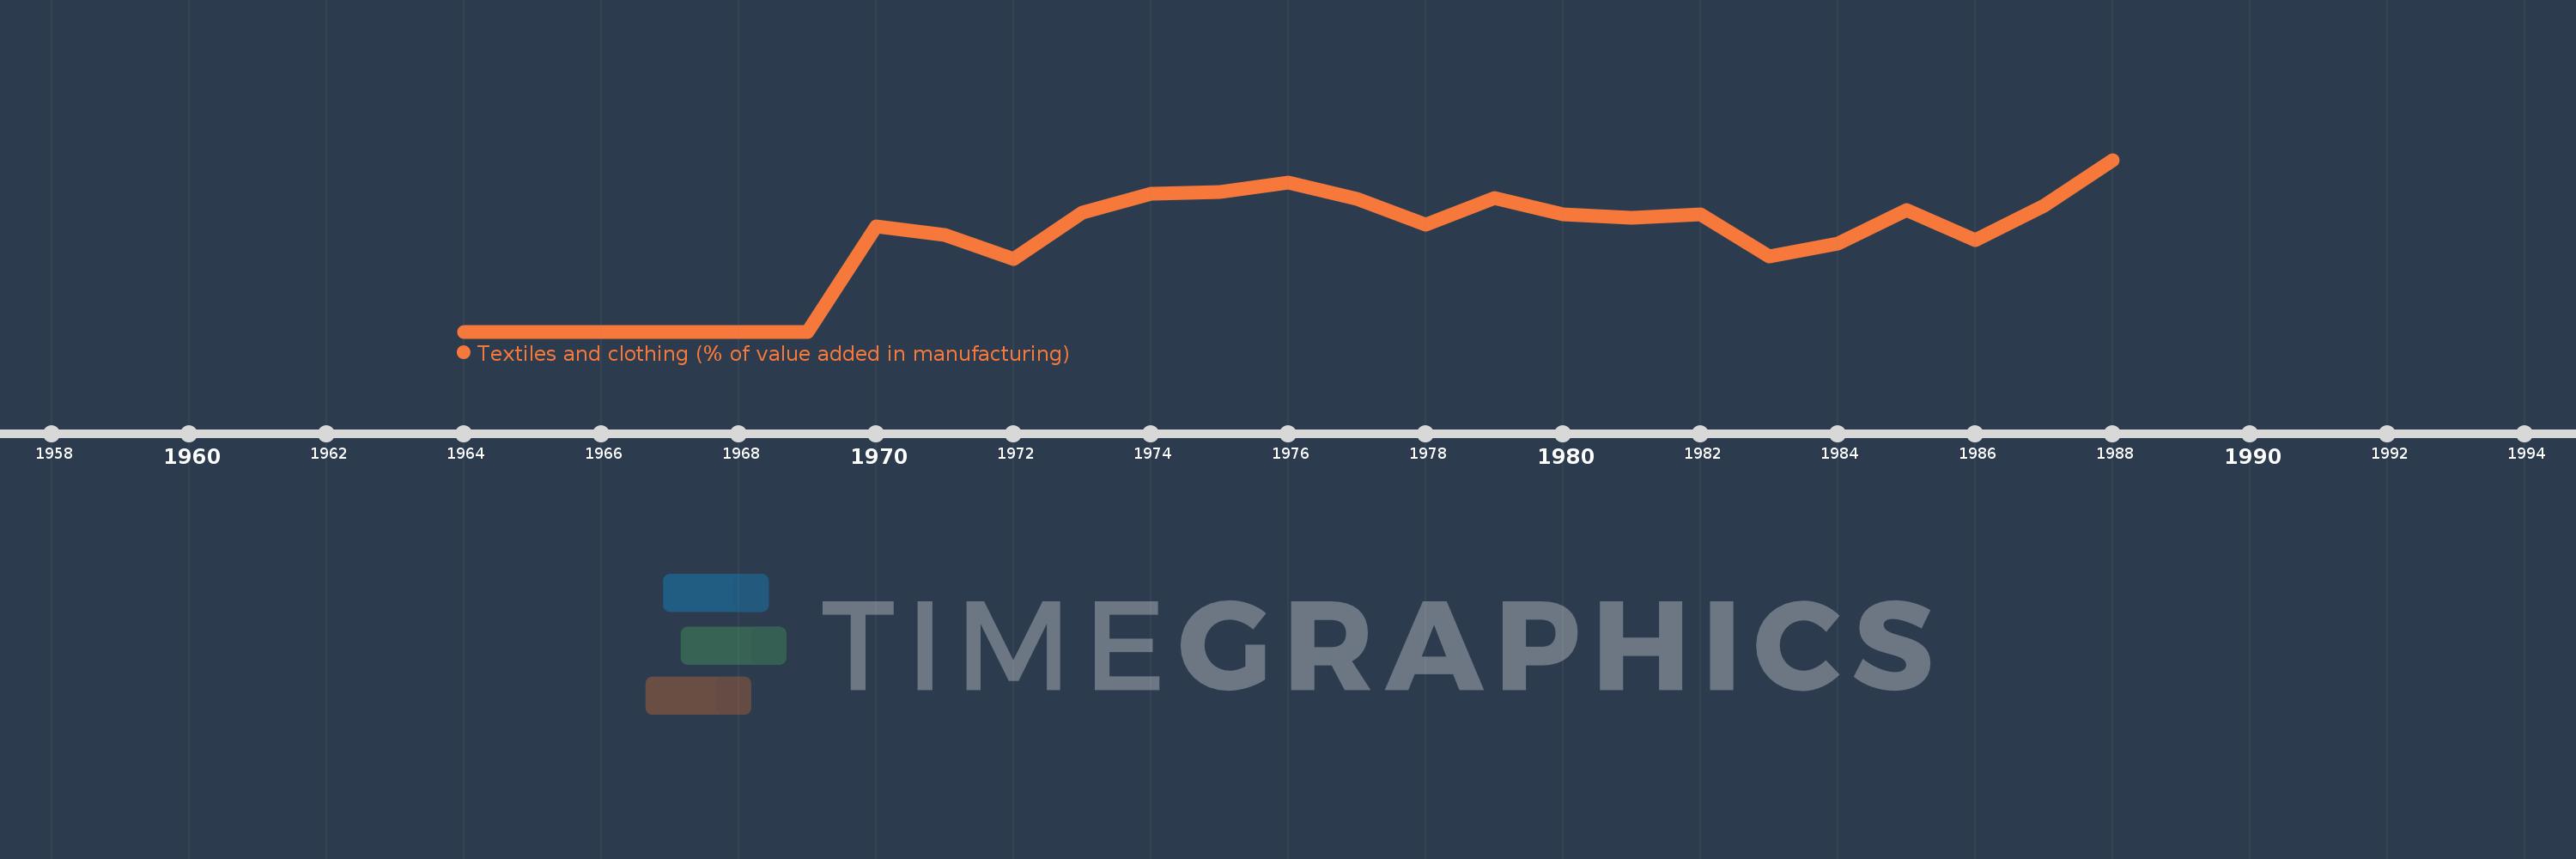
Textiles and clothing (% of value added in manufacturing)
1988,1987,1986,1985,1984,1983,1982,1981,1980,1979,1978,1977,1976,1975,1974,1973,1972,1971,1970,1969,1968,1967,1966,1965,1964
This statistics in other country:
AlbaniaAlgeriaArgentinaAustraliaAustriaAzerbaijanBahamas, TheBahrainBangladeshBarbadosBelarusBelgiumBelizeBeninBoliviaBosnia and HerzegovinaBotswanaBrazilBulgariaBurkina FasoBurundiCambodiaCameroonCanadaCentral African RepublicChileChinaColombiaCongo, Rep.Costa RicaCote d'IvoireCroatiaCubaCyprusCzech RepublicDenmarkDominican RepublicEcuadorEgypt, Arab Rep.El SalvadorEritreaEstoniaEthiopiaFijiFinlandFranceGabonGambia, TheGeorgiaGermanyGhanaGreeceGuatemalaHondurasHong Kong SAR, ChinaHungaryIcelandIndiaIndonesiaIran, Islamic Rep.IraqIrelandIsraelItalyJamaicaJapanJordanKazakhstanKenyaKorea, Rep.KuwaitKyrgyz RepublicLao PDRLatviaLebanonLesothoLibyaLithuaniaLuxembourgMacao SAR, ChinaMacedonia, FYRMadagascarMalawiMalaysiaMaltaMauritiusMexicoMoldovaMongoliaMoroccoMozambiqueNamibiaNepalNetherlandsNew ZealandNicaraguaNigerNigeriaNorwayOmanPakistanPanamaPapua New GuineaParaguayPeruPhilippinesPolandPortugalPuerto RicoQatarRomaniaRussian FederationRwandaSaudi ArabiaSenegalSerbiaSierra LeoneSingaporeSlovak RepublicSloveniaSomaliaSouth AfricaSpainSri LankaSt. LuciaSudanSwazilandSwedenSwitzerlandSyrian Arab RepublicTanzaniaThailandTongaTrinidad and TobagoTunisiaTurkeyUgandaUkraineUnited Arab EmiratesUnited KingdomUnited StatesUruguayVenezuela, RBVietnamWest Bank and GazaYemen, Rep.Zambia Timeline:
This timeline shows a graph from 1964 to 1988 of Papua New Guinea. No data until 1963. Number of actual observations by date: 25.
Source name:
World Development Indicators
Source organization:
United Nations Industrial Development Organization, International Yearbook of Industrial Statistics.
Categories, topics:
Economy & Growth
Last updated:
apr 23, 2017
Indicators value changes by year
At the date of observation
Value
Absolute change
Change from previous value
jan 1, 1970
0.648
+0.648
%
jan 1, 1971
0.593
-0.054
-8.4%
jan 1, 1972
0.445
-0.148
-25.0%
jan 1, 1973
0.729
+0.284
63.84%
jan 1, 1974
0.849
+0.12
16.5%
jan 1, 1975
0.859
+0.009
1.1%
jan 1, 1976
0.913
+0.054
6.31%
jan 1, 1977
0.816
-0.097
-10.6%
jan 1, 1978
0.657
-0.159
-19.5%
jan 1, 1979
0.822
+0.165
25.17%
jan 1, 1980
0.722
-0.1
-12.21%
jan 1, 1981
0.701
-0.021
-2.93%
jan 1, 1982
0.718
+0.017
2.48%
jan 1, 1983
0.464
-0.254
-35.39%
jan 1, 1984
0.543
+0.079
17.11%
jan 1, 1985
0.744
+0.201
37.0%
jan 1, 1986
0.562
-0.183
-24.53%
jan 1, 1987
0.773
+0.211
37.62%
jan 1, 1988
1.055
+0.281
36.38%
Ranking of countries by current statistics by years


Comments: