29
/
en
AIzaSyAYiBZKx7MnpbEhh9jyipgxe19OcubqV5w
April 1, 2024
213735
Nigeria
NGA
true
2
1
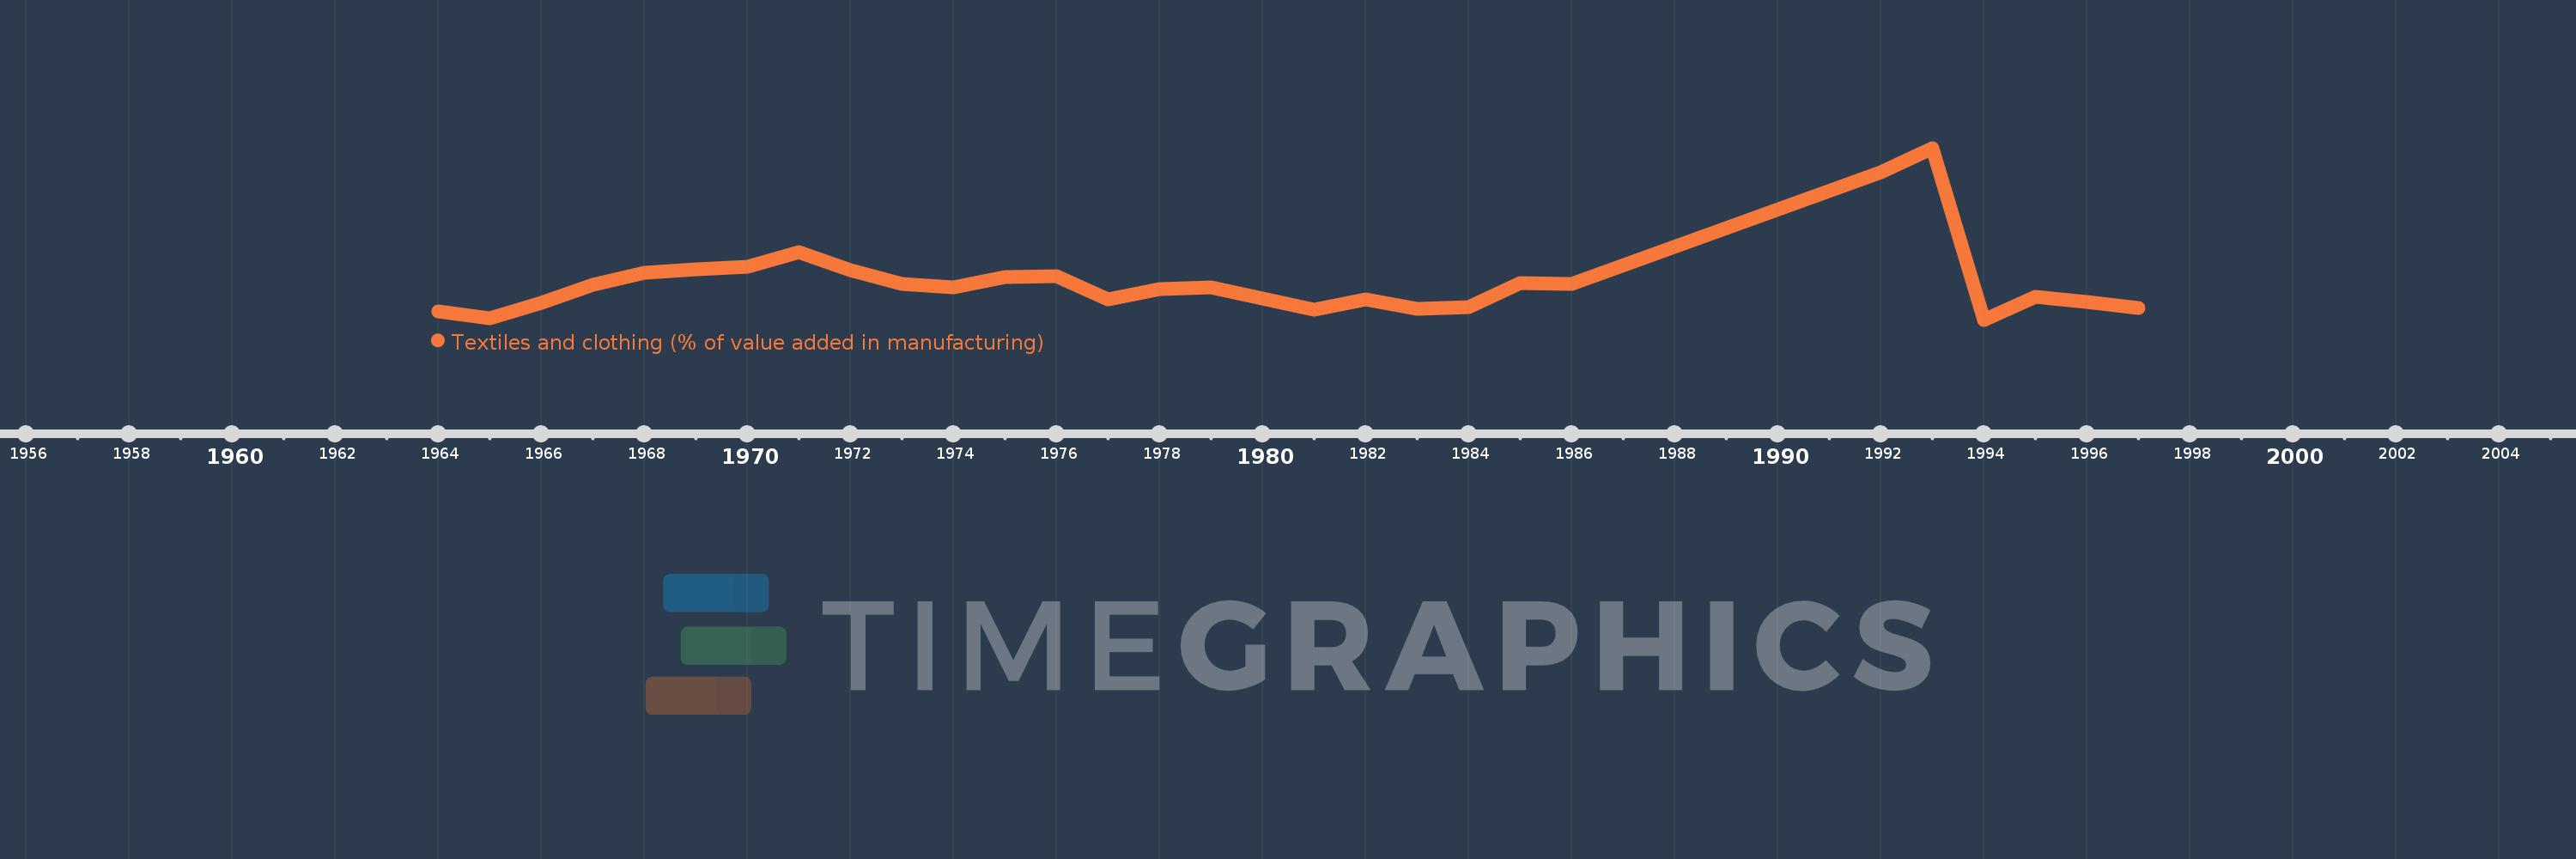
Textiles and clothing (% of value added in manufacturing)
1997,1996,1995,1994,1993,1992,1986,1985,1984,1983,1982,1981,1979,1978,1977,1976,1975,1974,1973,1972,1971,1970,1969,1968,1967,1966,1965,1964
This statistics in other country:
AlbaniaAlgeriaArgentinaAustraliaAustriaAzerbaijanBahamas, TheBahrainBangladeshBarbadosBelarusBelgiumBelizeBeninBoliviaBosnia and HerzegovinaBotswanaBrazilBulgariaBurkina FasoBurundiCambodiaCameroonCanadaCentral African RepublicChileChinaColombiaCongo, Rep.Costa RicaCote d'IvoireCroatiaCubaCyprusCzech RepublicDenmarkDominican RepublicEcuadorEgypt, Arab Rep.El SalvadorEritreaEstoniaEthiopiaFijiFinlandFranceGabonGambia, TheGeorgiaGermanyGhanaGreeceGuatemalaHondurasHong Kong SAR, ChinaHungaryIcelandIndiaIndonesiaIran, Islamic Rep.IraqIrelandIsraelItalyJamaicaJapanJordanKazakhstanKenyaKorea, Rep.KuwaitKyrgyz RepublicLao PDRLatviaLebanonLesothoLibyaLithuaniaLuxembourgMacao SAR, ChinaMacedonia, FYRMadagascarMalawiMalaysiaMaltaMauritiusMexicoMoldovaMongoliaMoroccoMozambiqueNamibiaNepalNetherlandsNew ZealandNicaraguaNigerNigeriaNorwayOmanPakistanPanamaPapua New GuineaParaguayPeruPhilippinesPolandPortugalPuerto RicoQatarRomaniaRussian FederationRwandaSaudi ArabiaSenegalSerbiaSierra LeoneSingaporeSlovak RepublicSloveniaSomaliaSouth AfricaSpainSri LankaSt. LuciaSudanSwazilandSwedenSwitzerlandSyrian Arab RepublicTanzaniaThailandTongaTrinidad and TobagoTunisiaTurkeyUgandaUkraineUnited Arab EmiratesUnited KingdomUnited StatesUruguayVenezuela, RBVietnamWest Bank and GazaYemen, Rep.Zambia Timeline:
This timeline shows a graph from 1964 to 1997 of Nigeria. No data until 1963. Number of actual observations by date: 28.
Source name:
World Development Indicators
Source organization:
United Nations Industrial Development Organization, International Yearbook of Industrial Statistics.
Categories, topics:
Economy & Growth
Last updated:
apr 23, 2017
Indicators value changes by year
Maximum:
52.275
jan 1, 1993
At the date of observation
Value
Absolute change
Change from previous value
jan 1, 1964
10.229
+10.229
0.0%
jan 1, 1965
8.379
-1.85
-18.08%
jan 1, 1966
12.354
+3.975
47.44%
jan 1, 1967
16.984
+4.63
37.48%
jan 1, 1968
20.247
+3.263
19.21%
jan 1, 1969
21.114
+0.867
4.28%
jan 1, 1970
21.747
+0.633
3.0%
jan 1, 1971
25.565
+3.819
17.56%
jan 1, 1972
20.755
-4.811
-18.82%
jan 1, 1973
17.235
-3.52
-16.96%
jan 1, 1974
16.441
-0.793
-4.6%
jan 1, 1975
19.119
+2.678
16.29%
jan 1, 1976
19.23
+0.11
0.58%
jan 1, 1977
13.233
-5.997
-31.19%
jan 1, 1978
16.052
+2.82
21.31%
jan 1, 1979
16.385
+0.333
2.08%
jan 1, 1981
10.655
-5.73
-34.97%
jan 1, 1982
13.253
+2.597
24.38%
jan 1, 1983
10.927
-2.326
-17.55%
jan 1, 1984
11.373
+0.446
4.08%
jan 1, 1985
17.555
+6.182
54.36%
jan 1, 1986
17.381
-0.174
-0.99%
jan 1, 1992
46.07
+28.689
165.06%
jan 1, 1993
52.275
+6.205
13.47%
jan 1, 1994
8.078
-44.197
-84.55%
jan 1, 1995
13.87
+5.792
71.69%
jan 1, 1996
12.591
-1.279
-9.22%
jan 1, 1997
11.091
-1.499
-11.91%
Ranking of countries by current statistics by years


Comments: