29
/
en
AIzaSyAYiBZKx7MnpbEhh9jyipgxe19OcubqV5w
April 1, 2024
145168
Guatemala
GTM
true
2
1
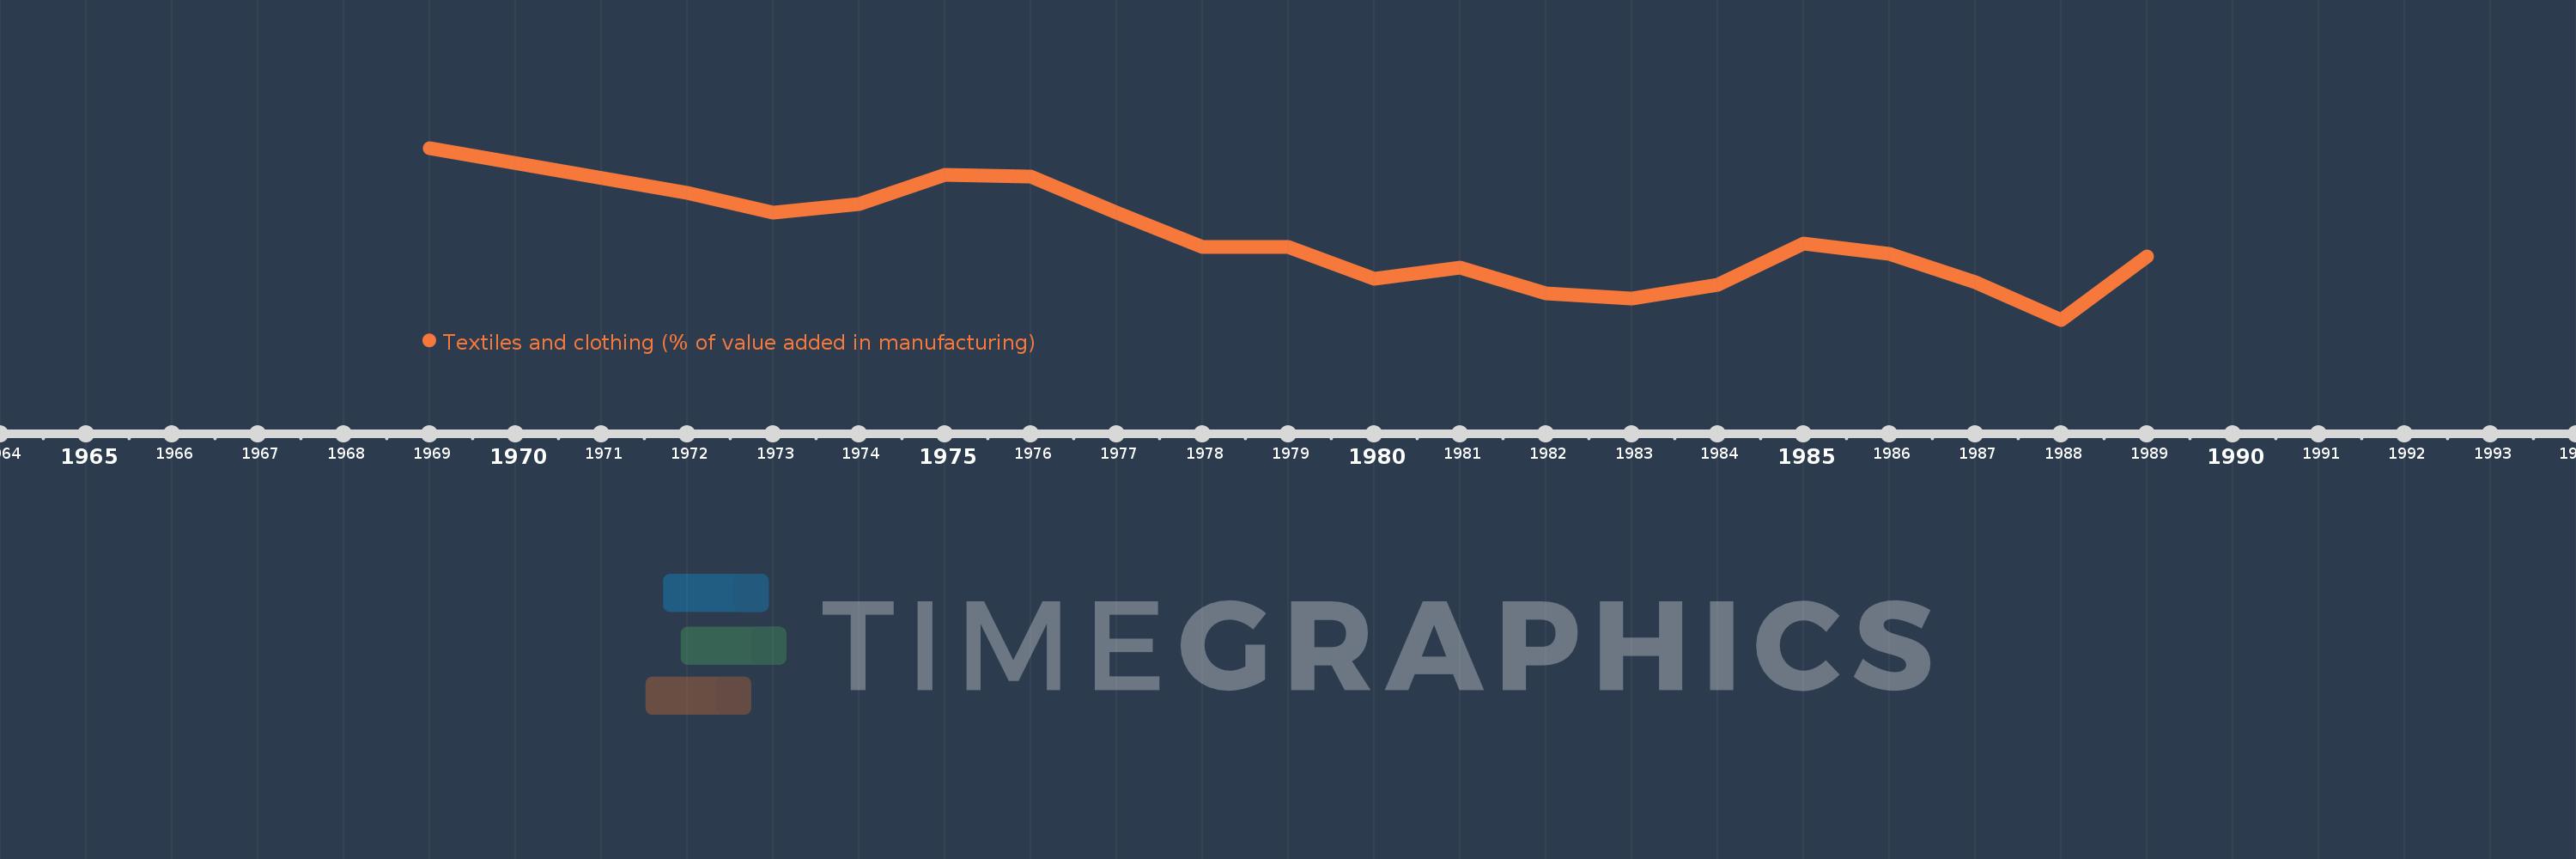
Textiles and clothing (% of value added in manufacturing)
1989,1988,1987,1986,1985,1984,1983,1982,1981,1980,1979,1978,1977,1976,1975,1974,1973,1972,1969
This statistics in other country:
AlbaniaAlgeriaArgentinaAustraliaAustriaAzerbaijanBahamas, TheBahrainBangladeshBarbadosBelarusBelgiumBelizeBeninBoliviaBosnia and HerzegovinaBotswanaBrazilBulgariaBurkina FasoBurundiCambodiaCameroonCanadaCentral African RepublicChileChinaColombiaCongo, Rep.Costa RicaCote d'IvoireCroatiaCubaCyprusCzech RepublicDenmarkDominican RepublicEcuadorEgypt, Arab Rep.El SalvadorEritreaEstoniaEthiopiaFijiFinlandFranceGabonGambia, TheGeorgiaGermanyGhanaGreeceGuatemalaHondurasHong Kong SAR, ChinaHungaryIcelandIndiaIndonesiaIran, Islamic Rep.IraqIrelandIsraelItalyJamaicaJapanJordanKazakhstanKenyaKorea, Rep.KuwaitKyrgyz RepublicLao PDRLatviaLebanonLesothoLibyaLithuaniaLuxembourgMacao SAR, ChinaMacedonia, FYRMadagascarMalawiMalaysiaMaltaMauritiusMexicoMoldovaMongoliaMoroccoMozambiqueNamibiaNepalNetherlandsNew ZealandNicaraguaNigerNigeriaNorwayOmanPakistanPanamaPapua New GuineaParaguayPeruPhilippinesPolandPortugalPuerto RicoQatarRomaniaRussian FederationRwandaSaudi ArabiaSenegalSerbiaSierra LeoneSingaporeSlovak RepublicSloveniaSomaliaSouth AfricaSpainSri LankaSt. LuciaSudanSwazilandSwedenSwitzerlandSyrian Arab RepublicTanzaniaThailandTongaTrinidad and TobagoTunisiaTurkeyUgandaUkraineUnited Arab EmiratesUnited KingdomUnited StatesUruguayVenezuela, RBVietnamWest Bank and GazaYemen, Rep.Zambia Timeline:
This timeline shows a graph from 1969 to 1989 of Guatemala. No data until 1968. Number of actual observations by date: 19.
Source name:
World Development Indicators
Source organization:
United Nations Industrial Development Organization, International Yearbook of Industrial Statistics.
Categories, topics:
Economy & Growth
Last updated:
apr 23, 2017
Indicators value changes by year
Maximum:
15.979
jan 1, 1969
At the date of observation
Value
Absolute change
Change from previous value
jan 1, 1969
15.979
+15.979
0.0%
jan 1, 1972
13.837
-2.143
-13.41%
jan 1, 1973
12.904
-0.933
-6.74%
jan 1, 1974
13.313
+0.41
3.17%
jan 1, 1975
14.704
+1.39
10.44%
jan 1, 1976
14.621
-0.083
-0.56%
jan 1, 1977
12.914
-1.707
-11.67%
jan 1, 1978
11.301
-1.613
-12.49%
jan 1, 1979
11.302
+0.001
0.01%
jan 1, 1980
9.779
-1.523
-13.48%
jan 1, 1981
10.324
+0.545
5.57%
jan 1, 1982
9.081
-1.243
-12.04%
jan 1, 1983
8.849
-0.232
-2.56%
jan 1, 1984
9.477
+0.628
7.1%
jan 1, 1985
11.458
+1.981
20.9%
jan 1, 1986
10.975
-0.483
-4.22%
jan 1, 1987
9.632
-1.343
-12.23%
jan 1, 1988
7.839
-1.793
-18.62%
jan 1, 1989
10.831
+2.992
38.17%
Ranking of countries by current statistics by years


Comments: