29
/
en
AIzaSyAYiBZKx7MnpbEhh9jyipgxe19OcubqV5w
April 1, 2024
199931
Mongolia
MNG
true
2
1
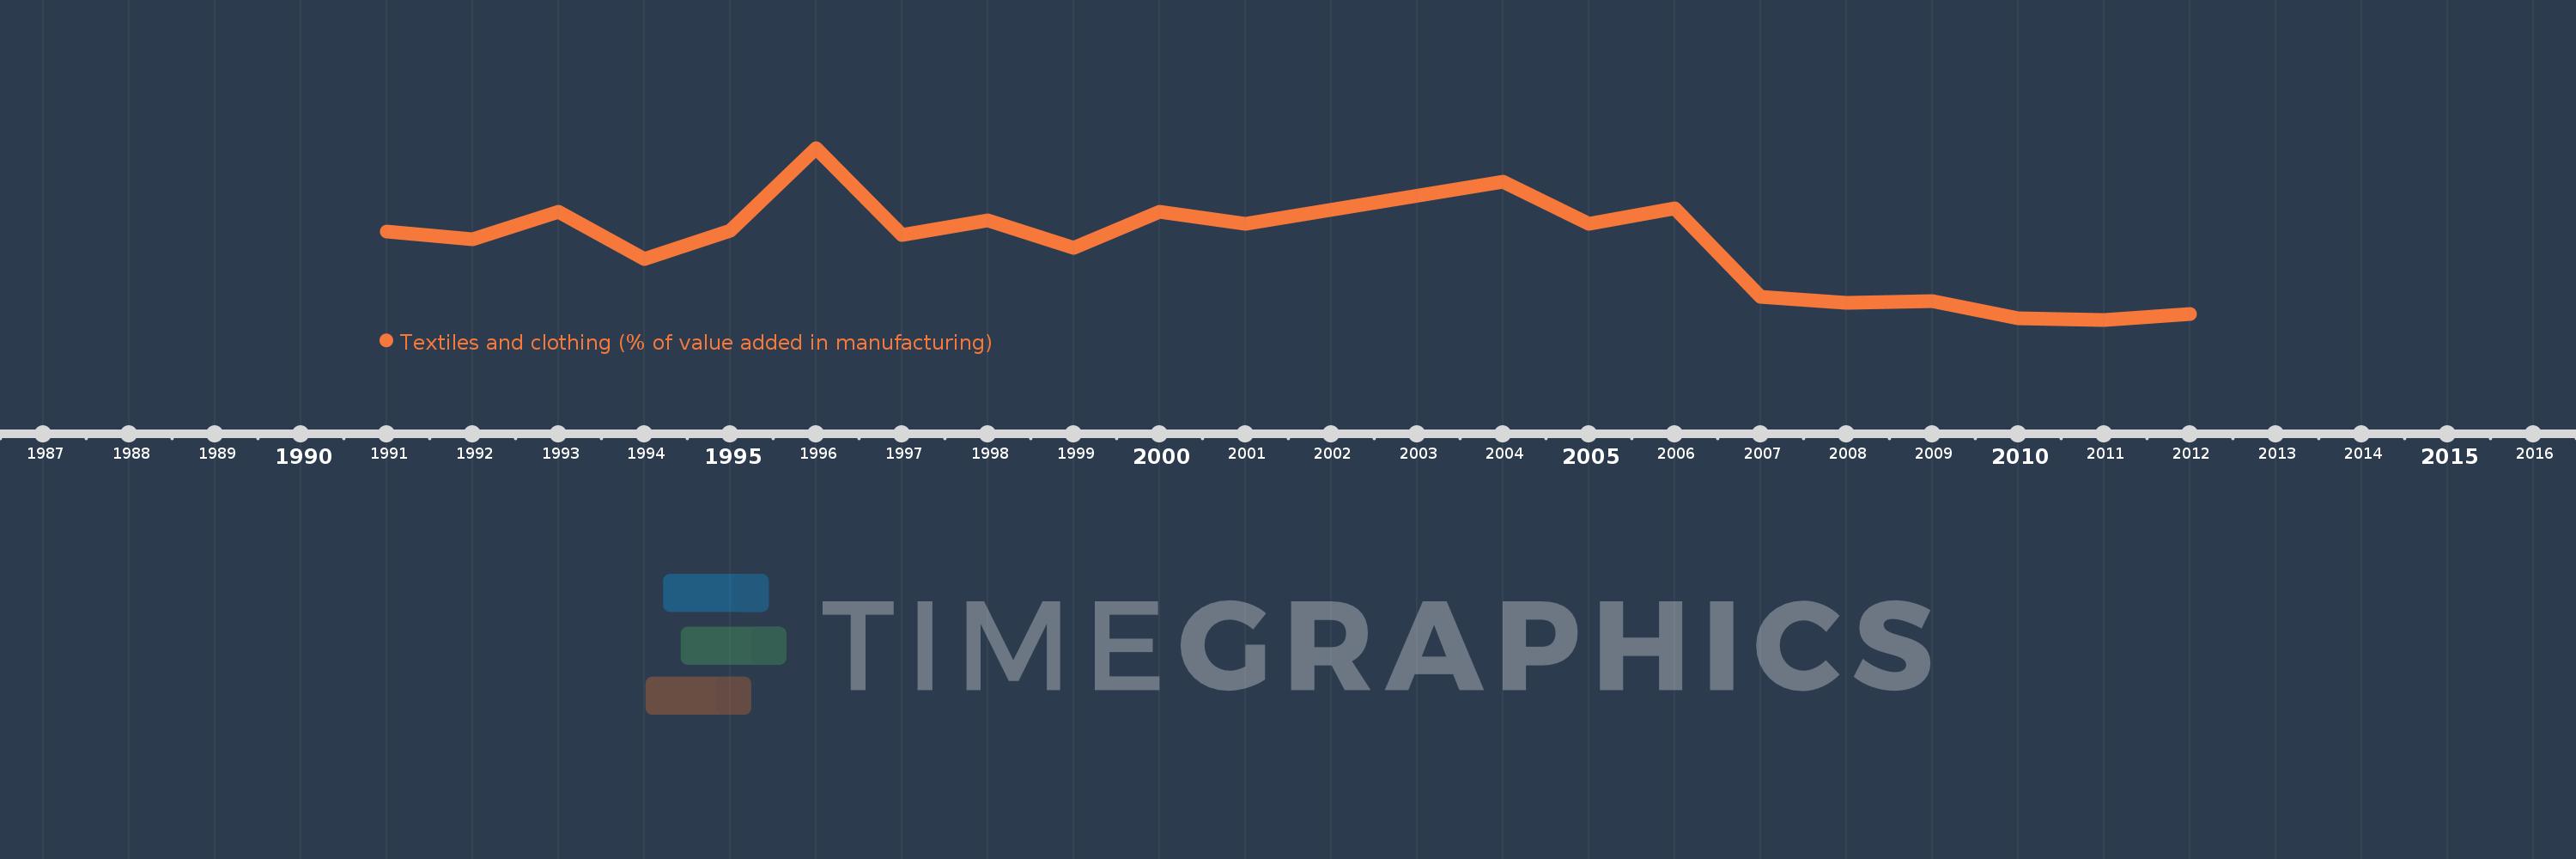
Textiles and clothing (% of value added in manufacturing)
2012,2011,2010,2009,2008,2007,2006,2005,2004,2001,2000,1999,1998,1997,1996,1995,1994,1993,1992,1991
This statistics in other country:
AlbaniaAlgeriaArgentinaAustraliaAustriaAzerbaijanBahamas, TheBahrainBangladeshBarbadosBelarusBelgiumBelizeBeninBoliviaBosnia and HerzegovinaBotswanaBrazilBulgariaBurkina FasoBurundiCambodiaCameroonCanadaCentral African RepublicChileChinaColombiaCongo, Rep.Costa RicaCote d'IvoireCroatiaCubaCyprusCzech RepublicDenmarkDominican RepublicEcuadorEgypt, Arab Rep.El SalvadorEritreaEstoniaEthiopiaFijiFinlandFranceGabonGambia, TheGeorgiaGermanyGhanaGreeceGuatemalaHondurasHong Kong SAR, ChinaHungaryIcelandIndiaIndonesiaIran, Islamic Rep.IraqIrelandIsraelItalyJamaicaJapanJordanKazakhstanKenyaKorea, Rep.KuwaitKyrgyz RepublicLao PDRLatviaLebanonLesothoLibyaLithuaniaLuxembourgMacao SAR, ChinaMacedonia, FYRMadagascarMalawiMalaysiaMaltaMauritiusMexicoMoldovaMongoliaMoroccoMozambiqueNamibiaNepalNetherlandsNew ZealandNicaraguaNigerNigeriaNorwayOmanPakistanPanamaPapua New GuineaParaguayPeruPhilippinesPolandPortugalPuerto RicoQatarRomaniaRussian FederationRwandaSaudi ArabiaSenegalSerbiaSierra LeoneSingaporeSlovak RepublicSloveniaSomaliaSouth AfricaSpainSri LankaSt. LuciaSudanSwazilandSwedenSwitzerlandSyrian Arab RepublicTanzaniaThailandTongaTrinidad and TobagoTunisiaTurkeyUgandaUkraineUnited Arab EmiratesUnited KingdomUnited StatesUruguayVenezuela, RBVietnamWest Bank and GazaYemen, Rep.Zambia Timeline:
This timeline shows a graph from 1991 to 2012 of Mongolia. No data until 1990. Number of actual observations by date: 20.
Source name:
World Development Indicators
Source organization:
United Nations Industrial Development Organization, International Yearbook of Industrial Statistics.
Categories, topics:
Economy & Growth
Last updated:
apr 23, 2017
Indicators value changes by year
Minimum:
12.071
jan 1, 2011
Maximum:
61.414
jan 1, 1996
At the date of observation
Value
Absolute change
Change from previous value
jan 1, 1991
37.46
+37.46
0.0%
jan 1, 1992
35.273
-2.187
-5.84%
jan 1, 1993
42.975
+7.702
21.84%
jan 1, 1994
29.462
-13.513
-31.44%
jan 1, 1995
37.633
+8.171
27.73%
jan 1, 1996
61.414
+23.782
63.19%
jan 1, 1997
36.345
-25.069
-40.82%
jan 1, 1998
40.659
+4.314
11.87%
jan 1, 1999
32.747
-7.912
-19.46%
jan 1, 2000
43.005
+10.258
31.32%
jan 1, 2001
39.614
-3.392
-7.89%
jan 1, 2004
51.764
+12.15
30.67%
jan 1, 2005
39.737
-12.027
-23.23%
jan 1, 2006
44.125
+4.388
11.04%
jan 1, 2007
18.756
-25.369
-57.49%
jan 1, 2008
16.927
-1.828
-9.75%
jan 1, 2009
17.409
+0.482
2.85%
jan 1, 2010
12.47
-4.939
-28.37%
jan 1, 2011
12.071
-0.399
-3.2%
jan 1, 2012
13.676
+1.605
13.3%
Ranking of countries by current statistics by years


Comments: