29
/
en
AIzaSyAYiBZKx7MnpbEhh9jyipgxe19OcubqV5w
April 1, 2024
273039
Uganda
UGA
true
2
1
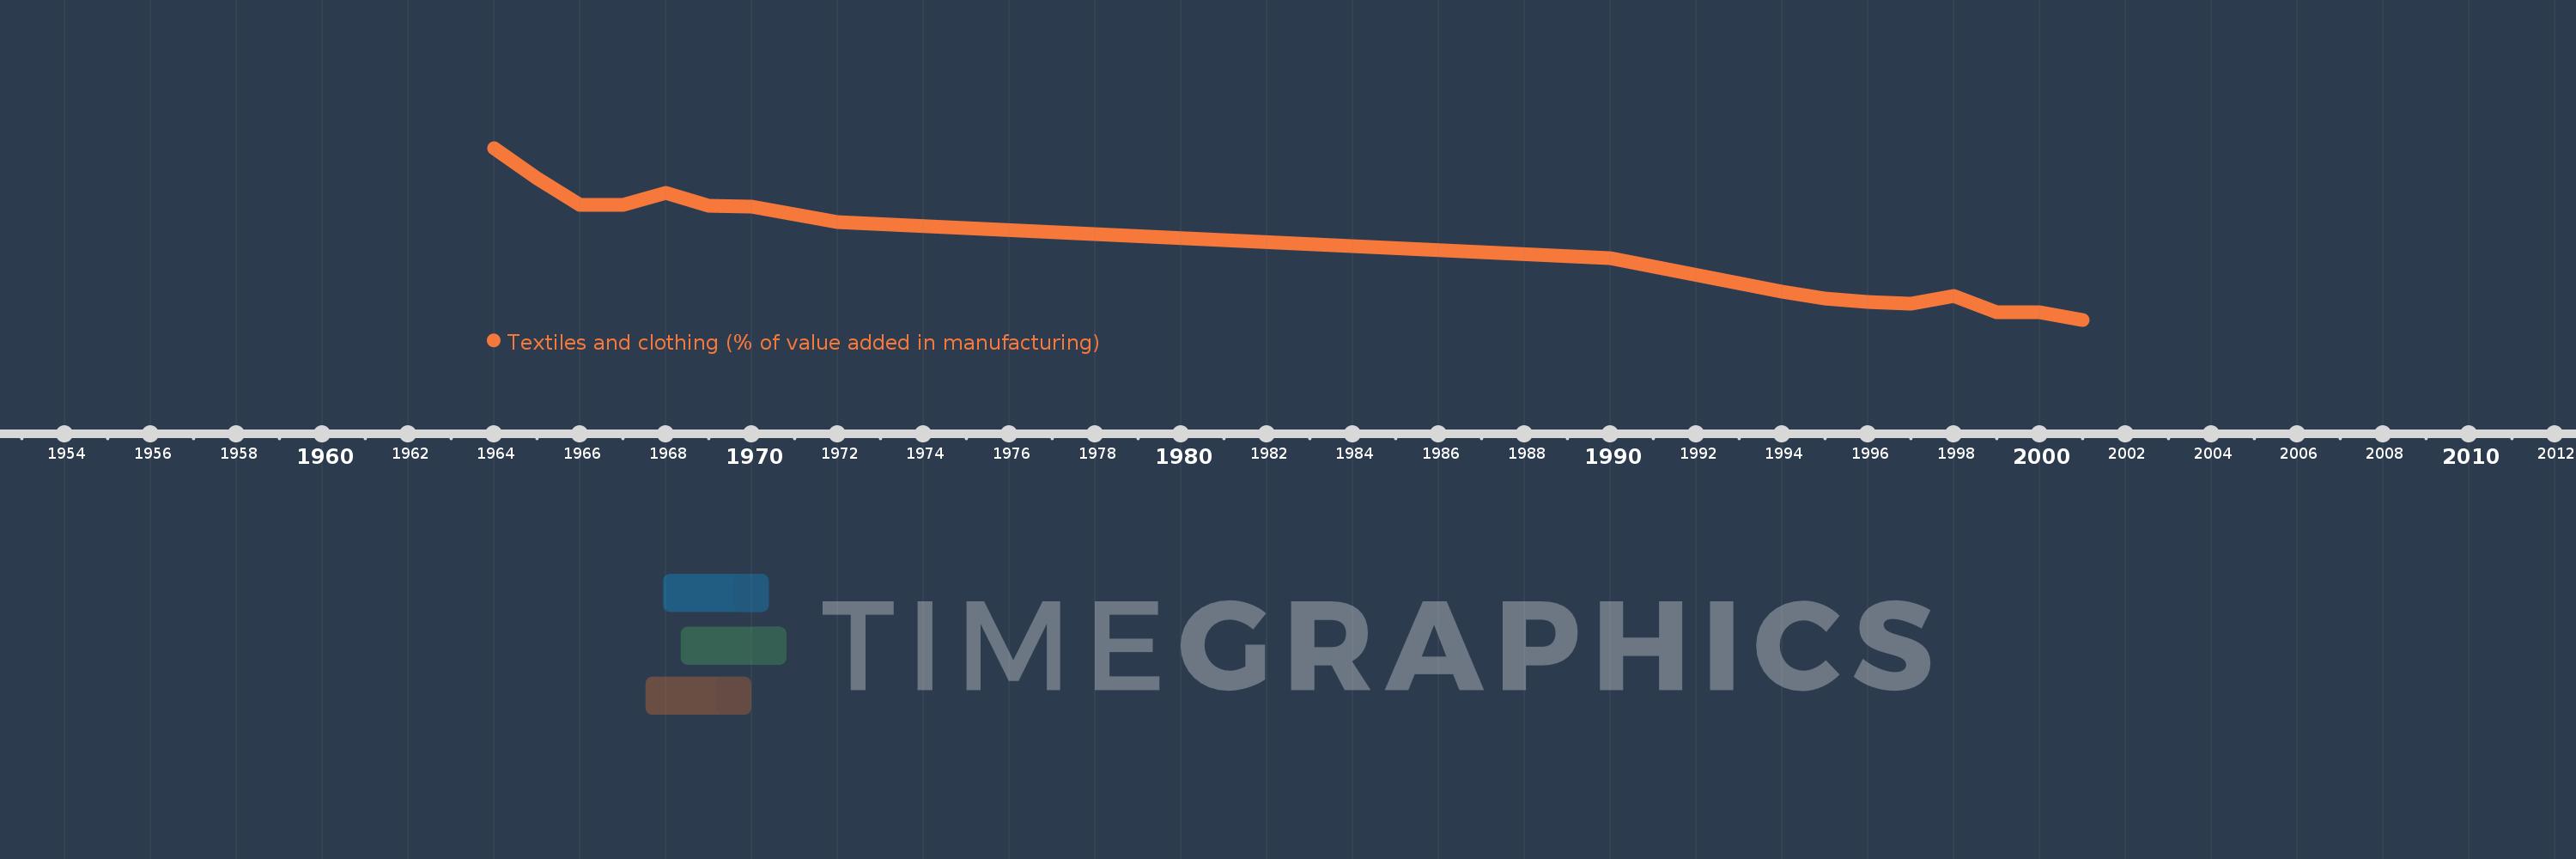
Textiles and clothing (% of value added in manufacturing)
2001,2000,1999,1998,1997,1996,1995,1994,1990,1972,1970,1969,1968,1967,1966,1965,1964
This statistics in other country:
AlbaniaAlgeriaArgentinaAustraliaAustriaAzerbaijanBahamas, TheBahrainBangladeshBarbadosBelarusBelgiumBelizeBeninBoliviaBosnia and HerzegovinaBotswanaBrazilBulgariaBurkina FasoBurundiCambodiaCameroonCanadaCentral African RepublicChileChinaColombiaCongo, Rep.Costa RicaCote d'IvoireCroatiaCubaCyprusCzech RepublicDenmarkDominican RepublicEcuadorEgypt, Arab Rep.El SalvadorEritreaEstoniaEthiopiaFijiFinlandFranceGabonGambia, TheGeorgiaGermanyGhanaGreeceGuatemalaHondurasHong Kong SAR, ChinaHungaryIcelandIndiaIndonesiaIran, Islamic Rep.IraqIrelandIsraelItalyJamaicaJapanJordanKazakhstanKenyaKorea, Rep.KuwaitKyrgyz RepublicLao PDRLatviaLebanonLesothoLibyaLithuaniaLuxembourgMacao SAR, ChinaMacedonia, FYRMadagascarMalawiMalaysiaMaltaMauritiusMexicoMoldovaMongoliaMoroccoMozambiqueNamibiaNepalNetherlandsNew ZealandNicaraguaNigerNigeriaNorwayOmanPakistanPanamaPapua New GuineaParaguayPeruPhilippinesPolandPortugalPuerto RicoQatarRomaniaRussian FederationRwandaSaudi ArabiaSenegalSerbiaSierra LeoneSingaporeSlovak RepublicSloveniaSomaliaSouth AfricaSpainSri LankaSt. LuciaSudanSwazilandSwedenSwitzerlandSyrian Arab RepublicTanzaniaThailandTongaTrinidad and TobagoTunisiaTurkeyUgandaUkraineUnited Arab EmiratesUnited KingdomUnited StatesUruguayVenezuela, RBVietnamWest Bank and GazaYemen, Rep.Zambia Timeline:
This timeline shows a graph from 1964 to 2001 of Uganda. No data until 1963. Number of actual observations by date: 17.
Source name:
World Development Indicators
Source organization:
United Nations Industrial Development Organization, International Yearbook of Industrial Statistics.
Categories, topics:
Economy & Growth
Last updated:
apr 23, 2017
Indicators value changes by year
Maximum:
32.893
jan 1, 1964
At the date of observation
Value
Absolute change
Change from previous value
jan 1, 1964
32.893
+32.893
0.0%
jan 1, 1965
27.844
-5.05
-15.35%
jan 1, 1966
23.356
-4.487
-16.12%
jan 1, 1967
23.303
-0.054
-0.23%
jan 1, 1968
25.345
+2.042
8.76%
jan 1, 1969
23.191
-2.153
-8.5%
jan 1, 1970
22.97
-0.222
-0.96%
jan 1, 1972
20.419
-2.55
-11.1%
jan 1, 1990
14.36
-6.06
-29.68%
jan 1, 1994
8.747
-5.612
-39.08%
jan 1, 1995
7.558
-1.189
-13.59%
jan 1, 1996
7.015
-0.543
-7.19%
jan 1, 1997
6.749
-0.266
-3.8%
jan 1, 1998
8.003
+1.254
18.59%
jan 1, 1999
5.358
-2.645
-33.05%
jan 1, 2000
5.311
-0.046
-0.87%
jan 1, 2001
4.044
-1.267
-23.86%
Ranking of countries by current statistics by years


Comments: