29
/
en
AIzaSyAYiBZKx7MnpbEhh9jyipgxe19OcubqV5w
April 1, 2024
94328
Bulgaria
BGR
true
2
1
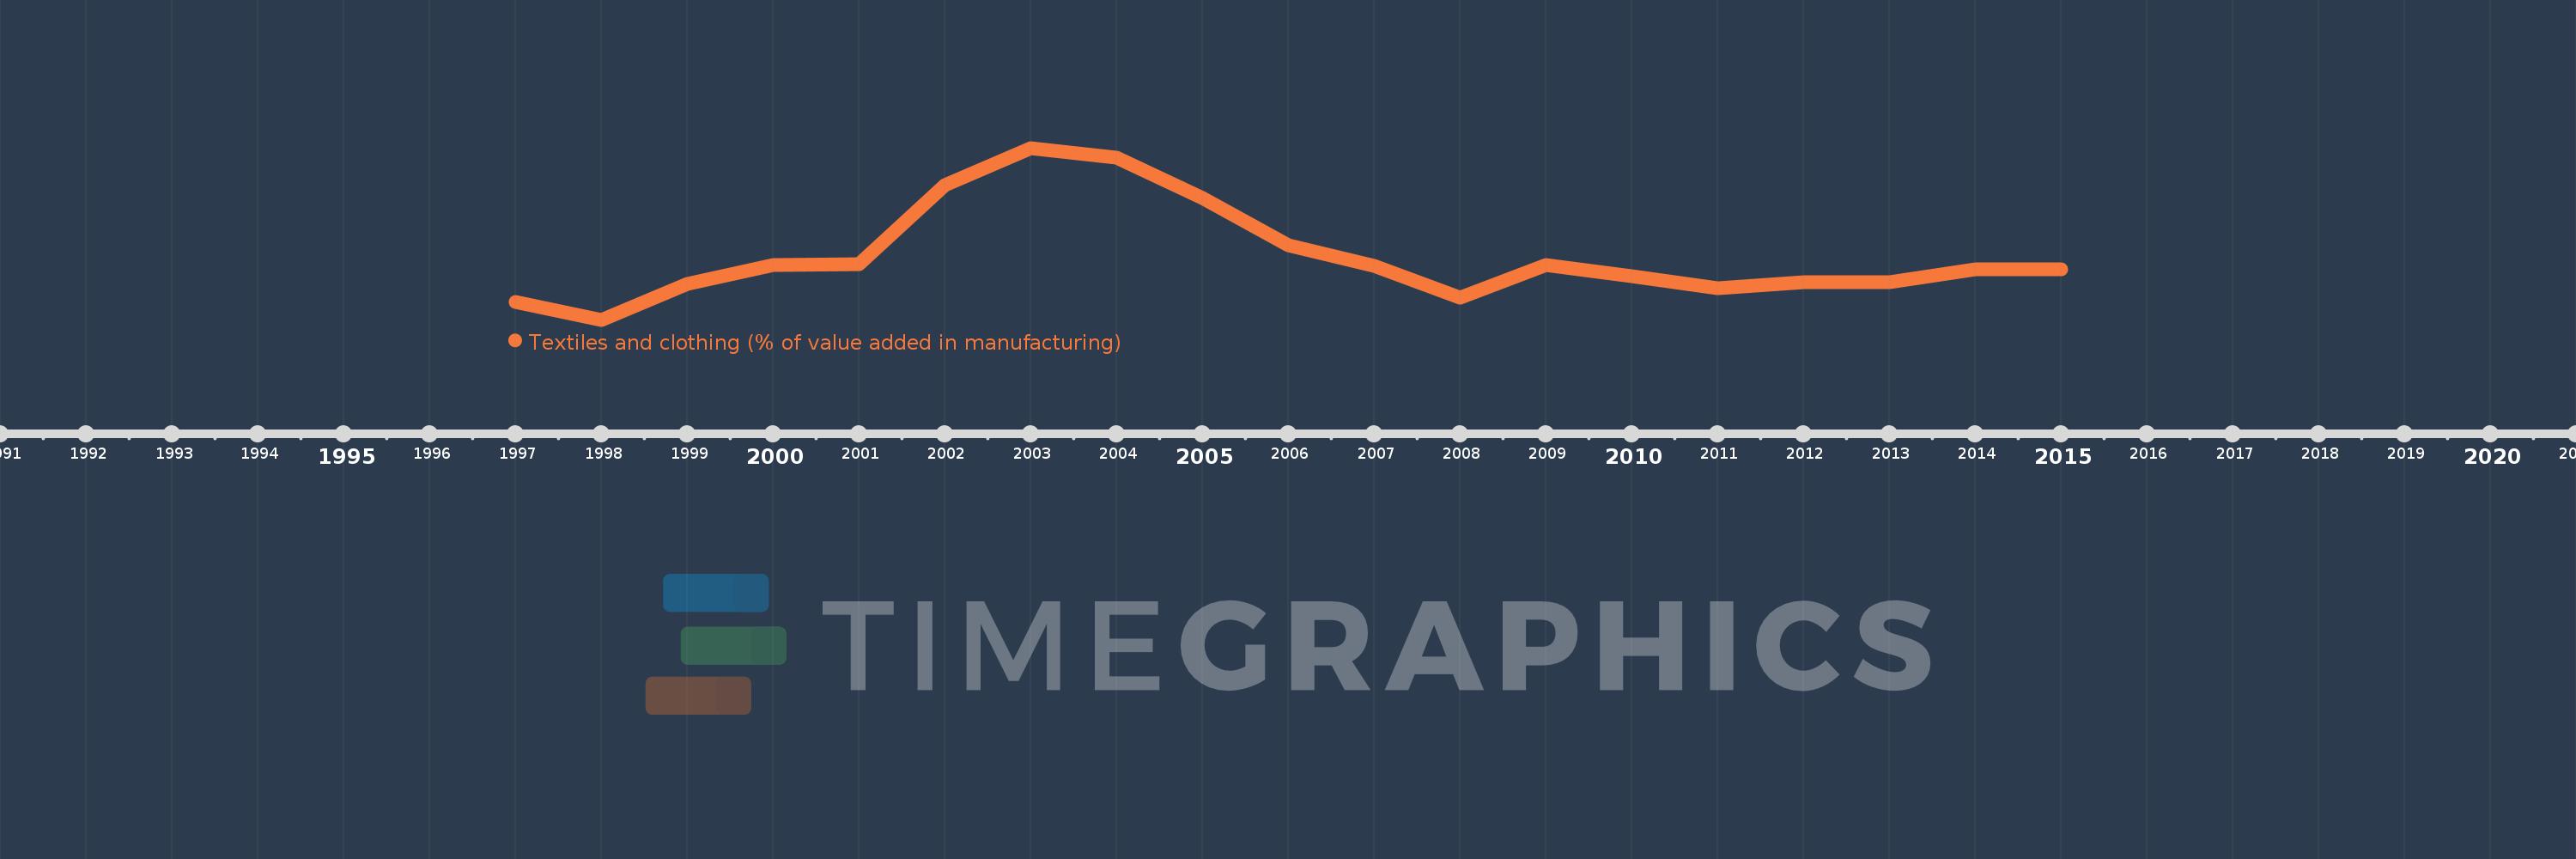
Textiles and clothing (% of value added in manufacturing)
2015,2014,2013,2012,2011,2010,2009,2008,2007,2006,2005,2004,2003,2002,2001,2000,1999,1998,1997
This statistics in other country:
AlbaniaAlgeriaArgentinaAustraliaAustriaAzerbaijanBahamas, TheBahrainBangladeshBarbadosBelarusBelgiumBelizeBeninBoliviaBosnia and HerzegovinaBotswanaBrazilBulgariaBurkina FasoBurundiCambodiaCameroonCanadaCentral African RepublicChileChinaColombiaCongo, Rep.Costa RicaCote d'IvoireCroatiaCubaCyprusCzech RepublicDenmarkDominican RepublicEcuadorEgypt, Arab Rep.El SalvadorEritreaEstoniaEthiopiaFijiFinlandFranceGabonGambia, TheGeorgiaGermanyGhanaGreeceGuatemalaHondurasHong Kong SAR, ChinaHungaryIcelandIndiaIndonesiaIran, Islamic Rep.IraqIrelandIsraelItalyJamaicaJapanJordanKazakhstanKenyaKorea, Rep.KuwaitKyrgyz RepublicLao PDRLatviaLebanonLesothoLibyaLithuaniaLuxembourgMacao SAR, ChinaMacedonia, FYRMadagascarMalawiMalaysiaMaltaMauritiusMexicoMoldovaMongoliaMoroccoMozambiqueNamibiaNepalNetherlandsNew ZealandNicaraguaNigerNigeriaNorwayOmanPakistanPanamaPapua New GuineaParaguayPeruPhilippinesPolandPortugalPuerto RicoQatarRomaniaRussian FederationRwandaSaudi ArabiaSenegalSerbiaSierra LeoneSingaporeSlovak RepublicSloveniaSomaliaSouth AfricaSpainSri LankaSt. LuciaSudanSwazilandSwedenSwitzerlandSyrian Arab RepublicTanzaniaThailandTongaTrinidad and TobagoTunisiaTurkeyUgandaUkraineUnited Arab EmiratesUnited KingdomUnited StatesUruguayVenezuela, RBVietnamWest Bank and GazaYemen, Rep.Zambia Timeline:
This timeline shows a graph from 1997 to 2015 of Bulgaria. No data until 1996. Number of actual observations by date: 19.
Source name:
World Development Indicators
Source organization:
United Nations Industrial Development Organization, International Yearbook of Industrial Statistics.
Categories, topics:
Economy & Growth
Last updated:
apr 23, 2017
Indicators value changes by year
Minimum:
10.879
jan 1, 1998
Maximum:
19.508
jan 1, 2003
At the date of observation
Value
Absolute change
Change from previous value
jan 1, 1997
11.773
+11.773
0.0%
jan 1, 1998
10.879
-0.894
-7.59%
jan 1, 1999
12.663
+1.784
16.4%
jan 1, 2000
13.612
+0.948
7.49%
jan 1, 2001
13.669
+0.057
0.42%
jan 1, 2002
17.656
+3.987
29.17%
jan 1, 2003
19.508
+1.852
10.49%
jan 1, 2004
19.028
-0.48
-2.46%
jan 1, 2005
17.002
-2.026
-10.65%
jan 1, 2006
14.603
-2.399
-14.11%
jan 1, 2007
13.602
-1.002
-6.86%
jan 1, 2008
12.008
-1.593
-11.71%
jan 1, 2009
13.646
+1.638
13.64%
jan 1, 2010
13.06
-0.586
-4.3%
jan 1, 2011
12.461
-0.598
-4.58%
jan 1, 2012
12.756
+0.295
2.37%
jan 1, 2013
12.777
+0.021
0.17%
jan 1, 2014
13.398
+0.62
4.85%
jan 1, 2015
13.398
0.0
0.0%
Ranking of countries by current statistics by years


Comments: