29
/
en
AIzaSyAYiBZKx7MnpbEhh9jyipgxe19OcubqV5w
April 1, 2024
183148
Macao SAR, China
MAC
true
2
1
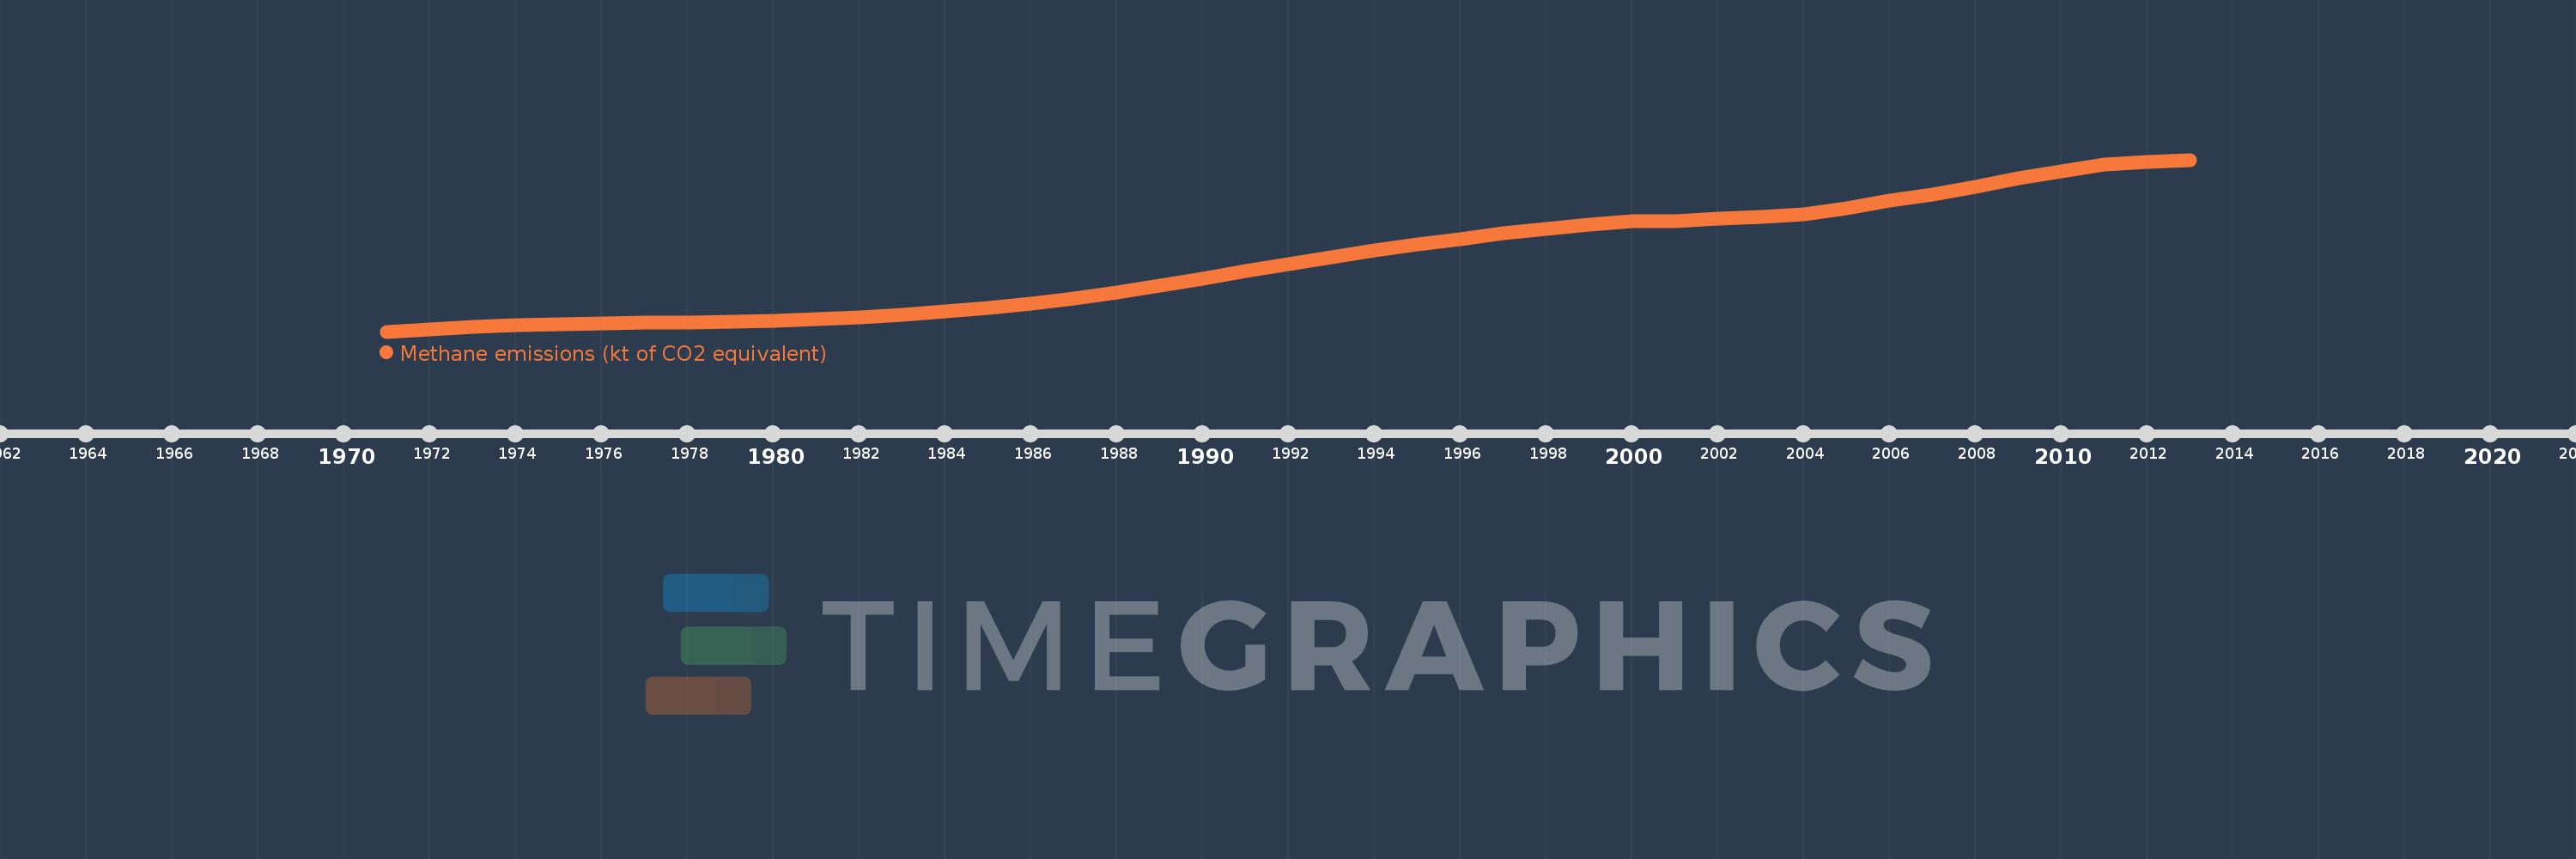
Methane emissions (kt of CO2 equivalent)
2013,2012,2011,2010,2009,2008,2007,2006,2005,2004,2003,2002,2001,2000,1999,1998,1997,1996,1995,1994,1993,1992,1991,1990,1989,1988,1987,1986,1985,1984,1983,1982,1981,1980,1979,1978,1977,1976,1975,1974,1973,1972,1971
This statistics in other country:
AfghanistanAlbaniaAlgeriaAmerican SamoaAngolaAntigua and BarbudaArab WorldArgentinaArmeniaArubaAustraliaAustriaAzerbaijanBahamas, TheBahrainBangladeshBarbadosBelarusBelgiumBelizeBeninBermudaBhutanBoliviaBosnia and HerzegovinaBotswanaBrazilBritish Virgin IslandsBrunei DarussalamBulgariaBurkina FasoBurundiCabo VerdeCambodiaCameroonCanadaCaribbean small statesCayman IslandsCentral African RepublicCentral Europe and the BalticsChadChileChinaColombiaComorosCongo, Dem. Rep.Congo, Rep.Costa RicaCote d'IvoireCroatiaCubaCyprusCzech RepublicDenmarkDjiboutiDominicaDominican RepublicEarly-demographic dividendEast Asia & PacificEast Asia & Pacific (excluding high income)East Asia & Pacific (IDA & IBRD countries)EcuadorEgypt, Arab Rep.El SalvadorEquatorial GuineaEritreaEstoniaEthiopiaEuro areaEurope & Central AsiaEurope & Central Asia (excluding high income)Europe & Central Asia (IDA & IBRD countries)European UnionFaroe IslandsFijiFinlandFragile and conflict affected situationsFranceFrench PolynesiaGabonGambia, TheGeorgiaGermanyGhanaGibraltarGreeceGreenlandGrenadaGuamGuatemalaGuineaGuinea-BissauGuyanaHaitiHeavily indebted poor countries (HIPC)High incomeHondurasHong Kong SAR, ChinaHungaryIBRD onlyIcelandIDA & IBRD totalIDA blendIDA onlyIDA totalIndiaIndonesiaIran, Islamic Rep.IraqIrelandIsraelItalyJamaicaJapanJordanKazakhstanKenyaKiribatiKorea, Dem. People’s Rep.Korea, Rep.KosovoKuwaitKyrgyz RepublicLao PDRLate-demographic dividendLatin America & Caribbean Latin America & Caribbean (excluding high income)Latin America & the Caribbean (IDA & IBRD countries)LatviaLeast developed countries: UN classificationLebanonLesothoLiberiaLibyaLithuaniaLow & middle incomeLow incomeLower middle incomeLuxembourgMacao SAR, ChinaMacedonia, FYRMadagascarMalawiMalaysiaMaldivesMaliMaltaMarshall IslandsMauritaniaMauritiusMexicoMicronesia, Fed. Sts.Middle East & North AfricaMiddle East & North Africa (excluding high income)Middle East & North Africa (IDA & IBRD countries)Middle incomeMoldovaMongoliaMontenegroMoroccoMozambiqueMyanmarNamibiaNauruNepalNetherlandsNew CaledoniaNew ZealandNicaraguaNigerNigeriaNorth AmericaNorthern Mariana IslandsNorwayOECD membersOmanOther small statesPacific island small statesPakistanPalauPanamaPapua New GuineaParaguayPeruPhilippinesPolandPortugalPost-demographic dividendPre-demographic dividendPuerto RicoQatarRomaniaRussian FederationRwandaSamoaSao Tome and PrincipeSaudi ArabiaSenegalSerbiaSeychellesSierra LeoneSingaporeSlovak RepublicSloveniaSmall statesSolomon IslandsSomaliaSouth AfricaSouth AsiaSouth Asia (IDA & IBRD)SpainSri LankaSt. Kitts and NevisSt. LuciaSt. Vincent and the GrenadinesSub-Saharan Africa Sub-Saharan Africa (excluding high income)Sub-Saharan Africa (IDA & IBRD countries)SudanSurinameSwazilandSwedenSwitzerlandSyrian Arab RepublicTajikistanTanzaniaThailandTimor-LesteTogoTongaTrinidad and TobagoTunisiaTurkeyTurkmenistanTurks and Caicos IslandsTuvaluUgandaUkraineUnited Arab EmiratesUnited KingdomUnited StatesUpper middle incomeUruguayUzbekistanVanuatuVenezuela, RBVietnamVirgin Islands (U.S.)WorldYemen, Rep.ZambiaZimbabwe Timeline:
This timeline shows a graph from 1971 to 2013 of Macao SAR, China. No data until 1970. Number of actual observations by date: 43.
Source name:
World Development Indicators
Source organization:
European Commission, Joint Research Centre (JRC)/Netherlands Environmental Assessment Agency (PBL). Emission Database for Global Atmospheric Research (EDGAR): http://edgar.jrc.ec.europa.eu/
Categories, topics:
Climate Change, Environment
Last updated:
apr 23, 2017
Indicators value changes by year
Maximum:
150.575
jan 1, 2013
At the date of observation
Value
Absolute change
Change from previous value
jan 1, 1971
48.87
+48.87
0.0%
jan 1, 1972
50.353
+1.483
3.03%
jan 1, 1973
51.465
+1.112
2.21%
jan 1, 1974
52.613
+1.147
2.23%
jan 1, 1975
53.359
+0.747
1.42%
jan 1, 1976
53.874
+0.514
0.96%
jan 1, 1977
54.159
+0.285
0.53%
jan 1, 1978
54.01
-0.149
-0.28%
jan 1, 1979
54.606
+0.597
1.1%
jan 1, 1980
55.044
+0.438
0.8%
jan 1, 1981
56.209
+1.164
2.12%
jan 1, 1982
57.174
+0.966
1.72%
jan 1, 1983
58.662
+1.487
2.6%
jan 1, 1984
60.797
+2.135
3.64%
jan 1, 1985
62.65
+1.853
3.05%
jan 1, 1986
65.624
+2.974
4.75%
jan 1, 1987
68.685
+3.061
4.67%
jan 1, 1988
71.93
+3.245
4.72%
jan 1, 1989
75.933
+4.002
5.56%
jan 1, 1990
79.956
+4.023
5.3%
jan 1, 1991
84.956
+5.0
6.25%
jan 1, 1992
88.997
+4.041
4.76%
jan 1, 1993
92.988
+3.991
4.48%
jan 1, 1994
96.955
+3.967
4.27%
jan 1, 1995
100.614
+3.659
3.77%
jan 1, 1996
103.76
+3.146
3.13%
jan 1, 1997
107.273
+3.513
3.39%
jan 1, 1998
109.757
+2.484
2.32%
jan 1, 1999
112.262
+2.505
2.28%
jan 1, 2000
114.338
+2.076
1.85%
jan 1, 2001
114.222
-0.116
-0.1%
jan 1, 2002
115.698
+1.476
1.29%
jan 1, 2003
116.691
+0.993
0.86%
jan 1, 2004
118.447
+1.756
1.5%
jan 1, 2005
121.722
+3.275
2.76%
jan 1, 2006
126.258
+4.536
3.73%
jan 1, 2007
129.756
+3.498
2.77%
jan 1, 2008
134.62
+4.864
3.75%
jan 1, 2009
139.82
+5.2
3.86%
jan 1, 2010
143.61
+3.79
2.71%
jan 1, 2011
147.623
+4.013
2.79%
jan 1, 2012
149.099
+1.476
1.0%
jan 1, 2013
150.575
+1.476
0.99%
Ranking of countries by current statistics by years


Comments: