29
/
en
AIzaSyAYiBZKx7MnpbEhh9jyipgxe19OcubqV5w
April 1, 2024
69024
Antigua and Barbuda
ATG
true
2
1
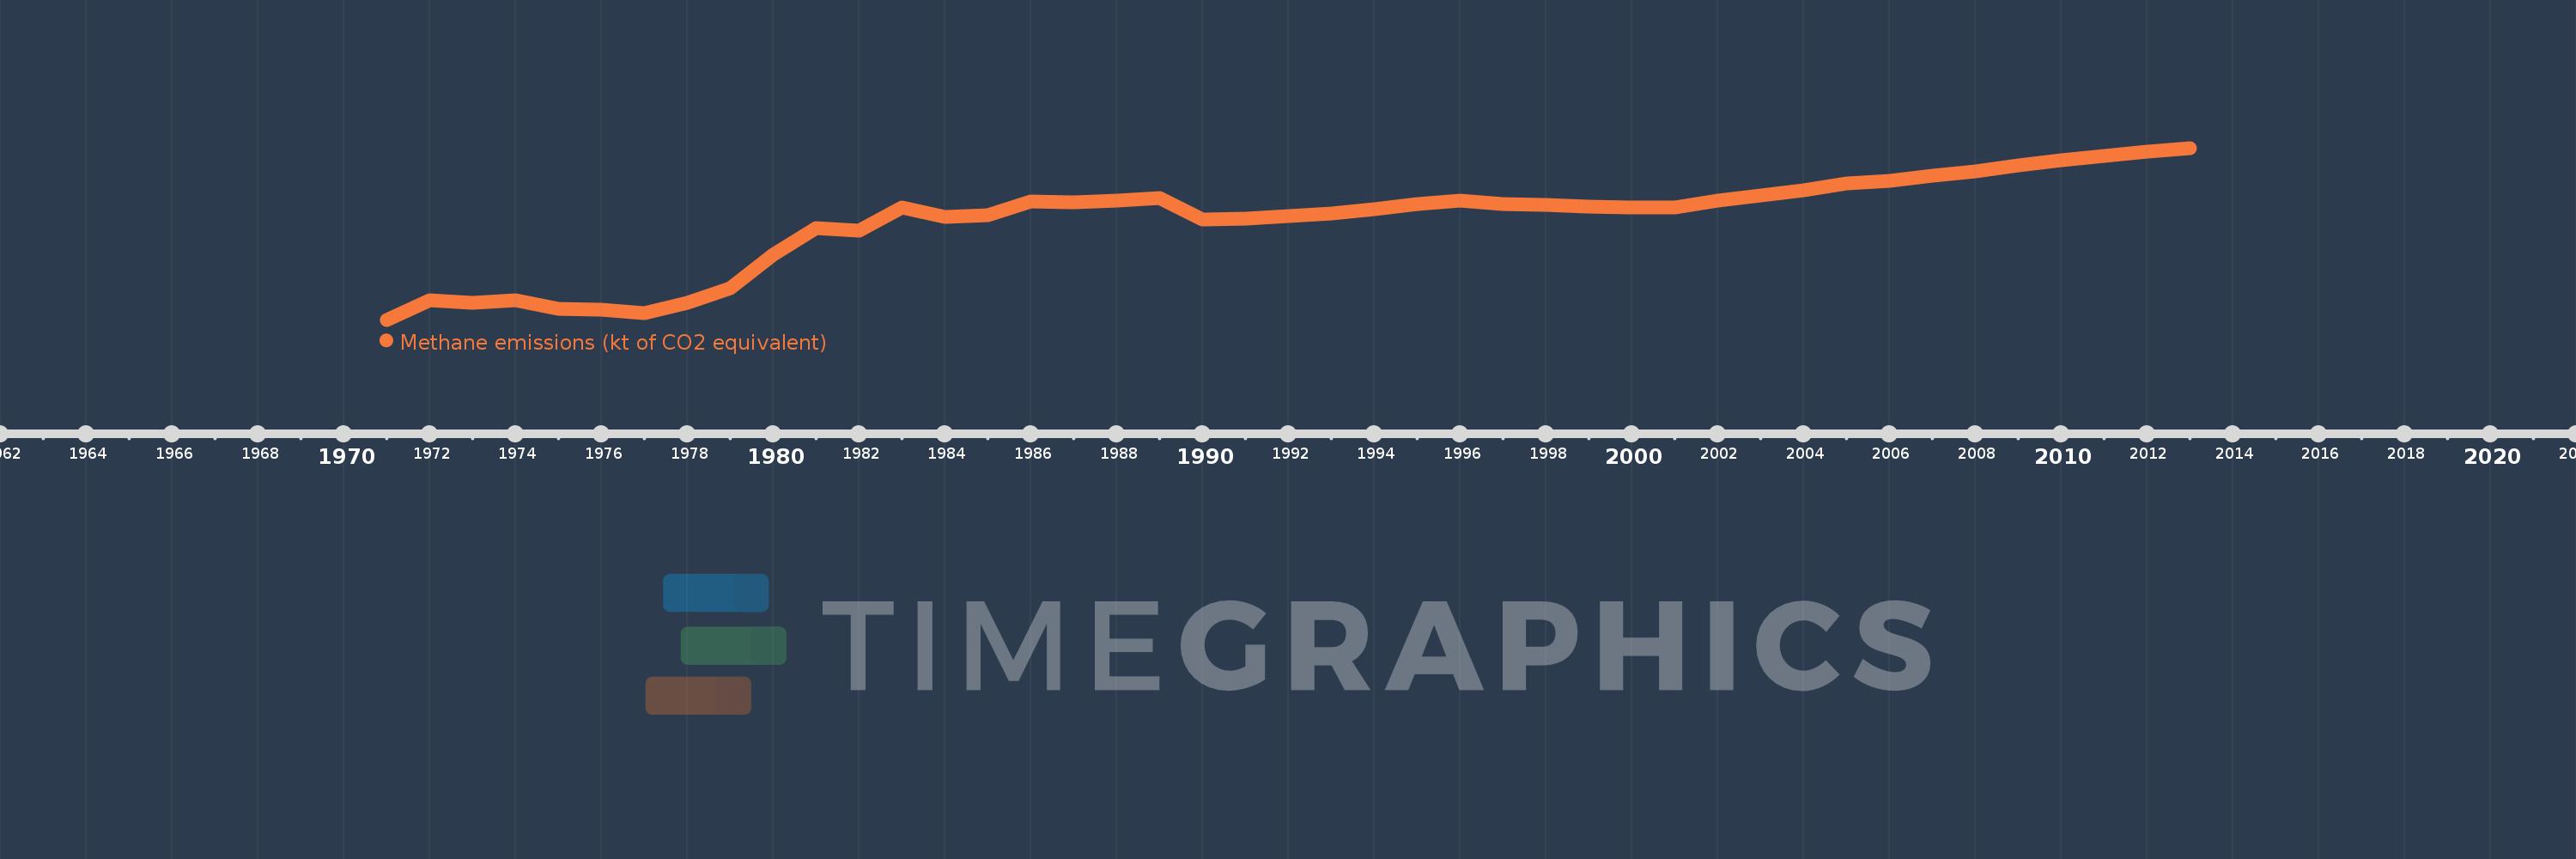
Methane emissions (kt of CO2 equivalent)
2013,2012,2011,2010,2009,2008,2007,2006,2005,2004,2003,2002,2001,2000,1999,1998,1997,1996,1995,1994,1993,1992,1991,1990,1989,1988,1987,1986,1985,1984,1983,1982,1981,1980,1979,1978,1977,1976,1975,1974,1973,1972,1971
This statistics in other country:
AfghanistanAlbaniaAlgeriaAmerican SamoaAngolaAntigua and BarbudaArab WorldArgentinaArmeniaArubaAustraliaAustriaAzerbaijanBahamas, TheBahrainBangladeshBarbadosBelarusBelgiumBelizeBeninBermudaBhutanBoliviaBosnia and HerzegovinaBotswanaBrazilBritish Virgin IslandsBrunei DarussalamBulgariaBurkina FasoBurundiCabo VerdeCambodiaCameroonCanadaCaribbean small statesCayman IslandsCentral African RepublicCentral Europe and the BalticsChadChileChinaColombiaComorosCongo, Dem. Rep.Congo, Rep.Costa RicaCote d'IvoireCroatiaCubaCyprusCzech RepublicDenmarkDjiboutiDominicaDominican RepublicEarly-demographic dividendEast Asia & PacificEast Asia & Pacific (excluding high income)East Asia & Pacific (IDA & IBRD countries)EcuadorEgypt, Arab Rep.El SalvadorEquatorial GuineaEritreaEstoniaEthiopiaEuro areaEurope & Central AsiaEurope & Central Asia (excluding high income)Europe & Central Asia (IDA & IBRD countries)European UnionFaroe IslandsFijiFinlandFragile and conflict affected situationsFranceFrench PolynesiaGabonGambia, TheGeorgiaGermanyGhanaGibraltarGreeceGreenlandGrenadaGuamGuatemalaGuineaGuinea-BissauGuyanaHaitiHeavily indebted poor countries (HIPC)High incomeHondurasHong Kong SAR, ChinaHungaryIBRD onlyIcelandIDA & IBRD totalIDA blendIDA onlyIDA totalIndiaIndonesiaIran, Islamic Rep.IraqIrelandIsraelItalyJamaicaJapanJordanKazakhstanKenyaKiribatiKorea, Dem. People’s Rep.Korea, Rep.KosovoKuwaitKyrgyz RepublicLao PDRLate-demographic dividendLatin America & Caribbean Latin America & Caribbean (excluding high income)Latin America & the Caribbean (IDA & IBRD countries)LatviaLeast developed countries: UN classificationLebanonLesothoLiberiaLibyaLithuaniaLow & middle incomeLow incomeLower middle incomeLuxembourgMacao SAR, ChinaMacedonia, FYRMadagascarMalawiMalaysiaMaldivesMaliMaltaMarshall IslandsMauritaniaMauritiusMexicoMicronesia, Fed. Sts.Middle East & North AfricaMiddle East & North Africa (excluding high income)Middle East & North Africa (IDA & IBRD countries)Middle incomeMoldovaMongoliaMontenegroMoroccoMozambiqueMyanmarNamibiaNauruNepalNetherlandsNew CaledoniaNew ZealandNicaraguaNigerNigeriaNorth AmericaNorthern Mariana IslandsNorwayOECD membersOmanOther small statesPacific island small statesPakistanPalauPanamaPapua New GuineaParaguayPeruPhilippinesPolandPortugalPost-demographic dividendPre-demographic dividendPuerto RicoQatarRomaniaRussian FederationRwandaSamoaSao Tome and PrincipeSaudi ArabiaSenegalSerbiaSeychellesSierra LeoneSingaporeSlovak RepublicSloveniaSmall statesSolomon IslandsSomaliaSouth AfricaSouth AsiaSouth Asia (IDA & IBRD)SpainSri LankaSt. Kitts and NevisSt. LuciaSt. Vincent and the GrenadinesSub-Saharan Africa Sub-Saharan Africa (excluding high income)Sub-Saharan Africa (IDA & IBRD countries)SudanSurinameSwazilandSwedenSwitzerlandSyrian Arab RepublicTajikistanTanzaniaThailandTimor-LesteTogoTongaTrinidad and TobagoTunisiaTurkeyTurkmenistanTurks and Caicos IslandsTuvaluUgandaUkraineUnited Arab EmiratesUnited KingdomUnited StatesUpper middle incomeUruguayUzbekistanVanuatuVenezuela, RBVietnamVirgin Islands (U.S.)WorldYemen, Rep.ZambiaZimbabwe Timeline:
This timeline shows a graph from 1971 to 2013 of Antigua and Barbuda. No data until 1970. Number of actual observations by date: 43.
Source name:
World Development Indicators
Source organization:
European Commission, Joint Research Centre (JRC)/Netherlands Environmental Assessment Agency (PBL). Emission Database for Global Atmospheric Research (EDGAR): http://edgar.jrc.ec.europa.eu/
Categories, topics:
Climate Change, Environment
Last updated:
apr 23, 2017
Indicators value changes by year
Minimum:
24.315
jan 1, 1971
Maximum:
43.273
jan 1, 2013
At the date of observation
Value
Absolute change
Change from previous value
jan 1, 1971
24.315
+24.315
0.0%
jan 1, 1972
26.425
+2.11
8.68%
jan 1, 1973
26.207
-0.218
-0.82%
jan 1, 1974
26.476
+0.269
1.03%
jan 1, 1975
25.5
-0.976
-3.69%
jan 1, 1976
25.434
-0.066
-0.26%
jan 1, 1977
25.009
-0.425
-1.67%
jan 1, 1978
26.164
+1.155
4.62%
jan 1, 1979
27.767
+1.603
6.13%
jan 1, 1980
31.496
+3.729
13.43%
jan 1, 1981
34.407
+2.911
9.24%
jan 1, 1982
34.181
-0.226
-0.66%
jan 1, 1983
36.722
+2.541
7.43%
jan 1, 1984
35.684
-1.038
-2.83%
jan 1, 1985
35.891
+0.207
0.58%
jan 1, 1986
37.374
+1.482
4.13%
jan 1, 1987
37.303
-0.071
-0.19%
jan 1, 1988
37.49
+0.188
0.5%
jan 1, 1989
37.762
+0.271
0.72%
jan 1, 1990
35.407
-2.354
-6.23%
jan 1, 1991
35.511
+0.103
0.29%
jan 1, 1992
35.764
+0.253
0.71%
jan 1, 1993
36.007
+0.243
0.68%
jan 1, 1994
36.471
+0.464
1.29%
jan 1, 1995
37.09
+0.62
1.7%
jan 1, 1996
37.486
+0.396
1.07%
jan 1, 1997
37.13
-0.356
-0.95%
jan 1, 1998
36.98
-0.15
-0.4%
jan 1, 1999
36.753
-0.227
-0.61%
jan 1, 2000
36.689
-0.064
-0.17%
jan 1, 2001
36.677
-0.012
-0.03%
jan 1, 2002
37.488
+0.811
2.21%
jan 1, 2003
38.069
+0.581
1.55%
jan 1, 2004
38.617
+0.548
1.44%
jan 1, 2005
39.402
+0.785
2.03%
jan 1, 2006
39.64
+0.238
0.6%
jan 1, 2007
40.191
+0.552
1.39%
jan 1, 2008
40.713
+0.522
1.3%
jan 1, 2009
41.341
+0.628
1.54%
jan 1, 2010
41.885
+0.544
1.32%
jan 1, 2011
42.425
+0.54
1.29%
jan 1, 2012
42.849
+0.424
1.0%
jan 1, 2013
43.273
+0.424
0.99%
Ranking of countries by current statistics by years


Comments: