29
/
en
AIzaSyAYiBZKx7MnpbEhh9jyipgxe19OcubqV5w
April 1, 2024
266011
Tonga
TON
true
2
1
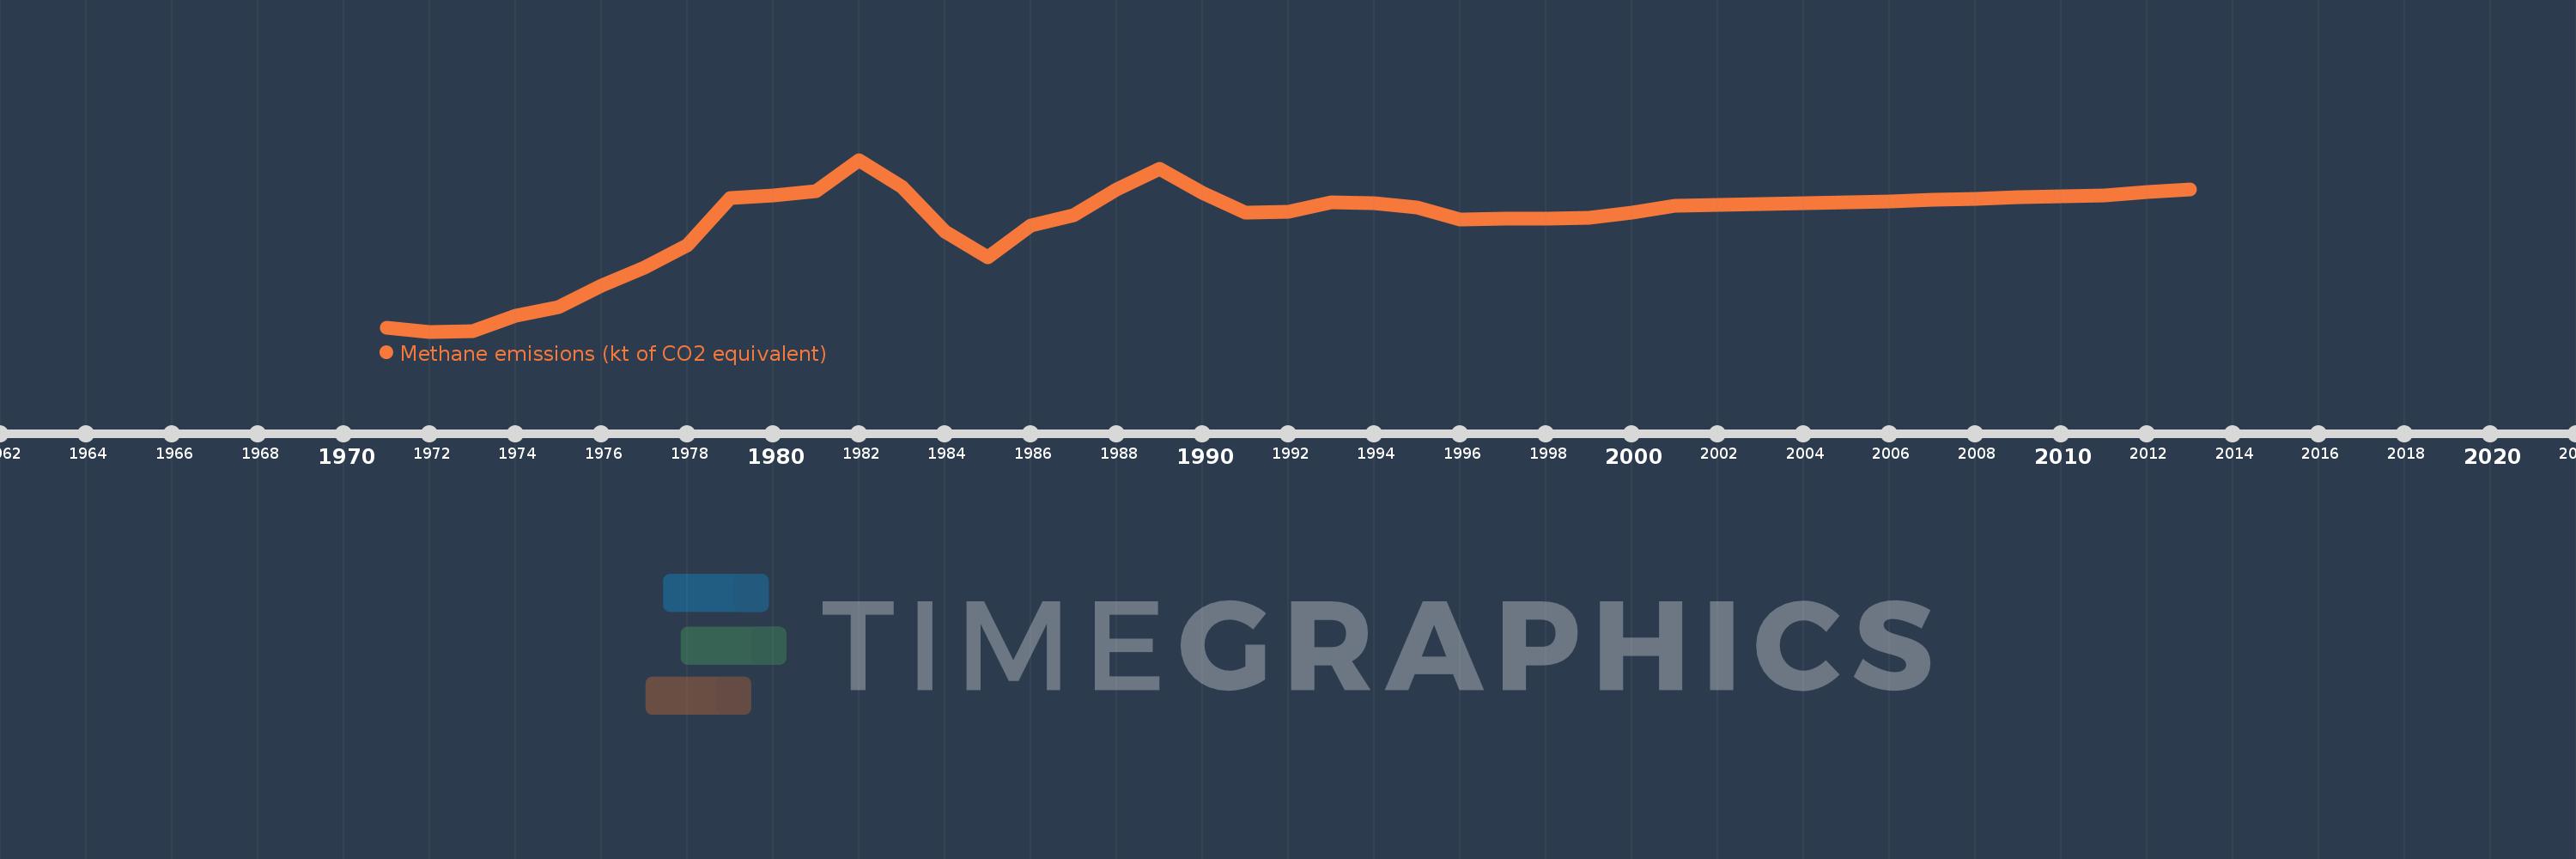
Methane emissions (kt of CO2 equivalent)
2013,2012,2011,2010,2009,2008,2007,2006,2005,2004,2003,2002,2001,2000,1999,1998,1997,1996,1995,1994,1993,1992,1991,1990,1989,1988,1987,1986,1985,1984,1983,1982,1981,1980,1979,1978,1977,1976,1975,1974,1973,1972,1971
This statistics in other country:
AfghanistanAlbaniaAlgeriaAmerican SamoaAngolaAntigua and BarbudaArab WorldArgentinaArmeniaArubaAustraliaAustriaAzerbaijanBahamas, TheBahrainBangladeshBarbadosBelarusBelgiumBelizeBeninBermudaBhutanBoliviaBosnia and HerzegovinaBotswanaBrazilBritish Virgin IslandsBrunei DarussalamBulgariaBurkina FasoBurundiCabo VerdeCambodiaCameroonCanadaCaribbean small statesCayman IslandsCentral African RepublicCentral Europe and the BalticsChadChileChinaColombiaComorosCongo, Dem. Rep.Congo, Rep.Costa RicaCote d'IvoireCroatiaCubaCyprusCzech RepublicDenmarkDjiboutiDominicaDominican RepublicEarly-demographic dividendEast Asia & PacificEast Asia & Pacific (excluding high income)East Asia & Pacific (IDA & IBRD countries)EcuadorEgypt, Arab Rep.El SalvadorEquatorial GuineaEritreaEstoniaEthiopiaEuro areaEurope & Central AsiaEurope & Central Asia (excluding high income)Europe & Central Asia (IDA & IBRD countries)European UnionFaroe IslandsFijiFinlandFragile and conflict affected situationsFranceFrench PolynesiaGabonGambia, TheGeorgiaGermanyGhanaGibraltarGreeceGreenlandGrenadaGuamGuatemalaGuineaGuinea-BissauGuyanaHaitiHeavily indebted poor countries (HIPC)High incomeHondurasHong Kong SAR, ChinaHungaryIBRD onlyIcelandIDA & IBRD totalIDA blendIDA onlyIDA totalIndiaIndonesiaIran, Islamic Rep.IraqIrelandIsraelItalyJamaicaJapanJordanKazakhstanKenyaKiribatiKorea, Dem. People’s Rep.Korea, Rep.KosovoKuwaitKyrgyz RepublicLao PDRLate-demographic dividendLatin America & Caribbean Latin America & Caribbean (excluding high income)Latin America & the Caribbean (IDA & IBRD countries)LatviaLeast developed countries: UN classificationLebanonLesothoLiberiaLibyaLithuaniaLow & middle incomeLow incomeLower middle incomeLuxembourgMacao SAR, ChinaMacedonia, FYRMadagascarMalawiMalaysiaMaldivesMaliMaltaMarshall IslandsMauritaniaMauritiusMexicoMicronesia, Fed. Sts.Middle East & North AfricaMiddle East & North Africa (excluding high income)Middle East & North Africa (IDA & IBRD countries)Middle incomeMoldovaMongoliaMontenegroMoroccoMozambiqueMyanmarNamibiaNauruNepalNetherlandsNew CaledoniaNew ZealandNicaraguaNigerNigeriaNorth AmericaNorthern Mariana IslandsNorwayOECD membersOmanOther small statesPacific island small statesPakistanPalauPanamaPapua New GuineaParaguayPeruPhilippinesPolandPortugalPost-demographic dividendPre-demographic dividendPuerto RicoQatarRomaniaRussian FederationRwandaSamoaSao Tome and PrincipeSaudi ArabiaSenegalSerbiaSeychellesSierra LeoneSingaporeSlovak RepublicSloveniaSmall statesSolomon IslandsSomaliaSouth AfricaSouth AsiaSouth Asia (IDA & IBRD)SpainSri LankaSt. Kitts and NevisSt. LuciaSt. Vincent and the GrenadinesSub-Saharan Africa Sub-Saharan Africa (excluding high income)Sub-Saharan Africa (IDA & IBRD countries)SudanSurinameSwazilandSwedenSwitzerlandSyrian Arab RepublicTajikistanTanzaniaThailandTimor-LesteTogoTongaTrinidad and TobagoTunisiaTurkeyTurkmenistanTurks and Caicos IslandsTuvaluUgandaUkraineUnited Arab EmiratesUnited KingdomUnited StatesUpper middle incomeUruguayUzbekistanVanuatuVenezuela, RBVietnamVirgin Islands (U.S.)WorldYemen, Rep.ZambiaZimbabwe Timeline:
This timeline shows a graph from 1971 to 2013 of Tonga. No data until 1970. Number of actual observations by date: 43.
Source name:
World Development Indicators
Source organization:
European Commission, Joint Research Centre (JRC)/Netherlands Environmental Assessment Agency (PBL). Emission Database for Global Atmospheric Research (EDGAR): http://edgar.jrc.ec.europa.eu/
Categories, topics:
Climate Change, Environment
Last updated:
apr 23, 2017
Indicators value changes by year
Minimum:
31.398
jan 1, 1972
Maximum:
67.714
jan 1, 1982
At the date of observation
Value
Absolute change
Change from previous value
jan 1, 1971
32.175
+32.175
0.0%
jan 1, 1972
31.398
-0.777
-2.42%
jan 1, 1973
31.492
+0.094
0.3%
jan 1, 1974
34.761
+3.269
10.38%
jan 1, 1975
36.514
+1.753
5.04%
jan 1, 1976
41.037
+4.523
12.39%
jan 1, 1977
44.952
+3.916
9.54%
jan 1, 1978
49.697
+4.744
10.55%
jan 1, 1979
59.605
+9.909
19.94%
jan 1, 1980
60.229
+0.624
1.05%
jan 1, 1981
61.043
+0.814
1.35%
jan 1, 1982
67.714
+6.671
10.93%
jan 1, 1983
61.951
-5.764
-8.51%
jan 1, 1984
52.583
-9.367
-15.12%
jan 1, 1985
47.131
-5.453
-10.37%
jan 1, 1986
53.771
+6.64
14.09%
jan 1, 1987
55.95
+2.179
4.05%
jan 1, 1988
61.454
+5.504
9.84%
jan 1, 1989
65.723
+4.269
6.95%
jan 1, 1990
60.812
-4.911
-7.47%
jan 1, 1991
56.544
-4.268
-7.02%
jan 1, 1992
56.726
+0.182
0.32%
jan 1, 1993
58.79
+2.065
3.64%
jan 1, 1994
58.588
-0.202
-0.34%
jan 1, 1995
57.698
-0.89
-1.52%
jan 1, 1996
55.03
-2.668
-4.62%
jan 1, 1997
55.349
+0.319
0.58%
jan 1, 1998
55.326
-0.024
-0.04%
jan 1, 1999
55.372
+0.046
0.08%
jan 1, 2000
56.583
+1.211
2.19%
jan 1, 2001
58.035
+1.452
2.57%
jan 1, 2002
58.217
+0.182
0.31%
jan 1, 2003
58.301
+0.084
0.14%
jan 1, 2004
58.497
+0.196
0.34%
jan 1, 2005
58.722
+0.225
0.38%
jan 1, 2006
58.965
+0.243
0.41%
jan 1, 2007
59.215
+0.249
0.42%
jan 1, 2008
59.496
+0.281
0.47%
jan 1, 2009
59.736
+0.24
0.4%
jan 1, 2010
60.001
+0.265
0.44%
jan 1, 2011
60.244
+0.244
0.41%
jan 1, 2012
60.847
+0.602
1.0%
jan 1, 2013
61.449
+0.602
0.99%
Ranking of countries by current statistics by years


Comments: