29
/
en
AIzaSyAYiBZKx7MnpbEhh9jyipgxe19OcubqV5w
April 1, 2024
191664
Malta
MLT
true
2
1
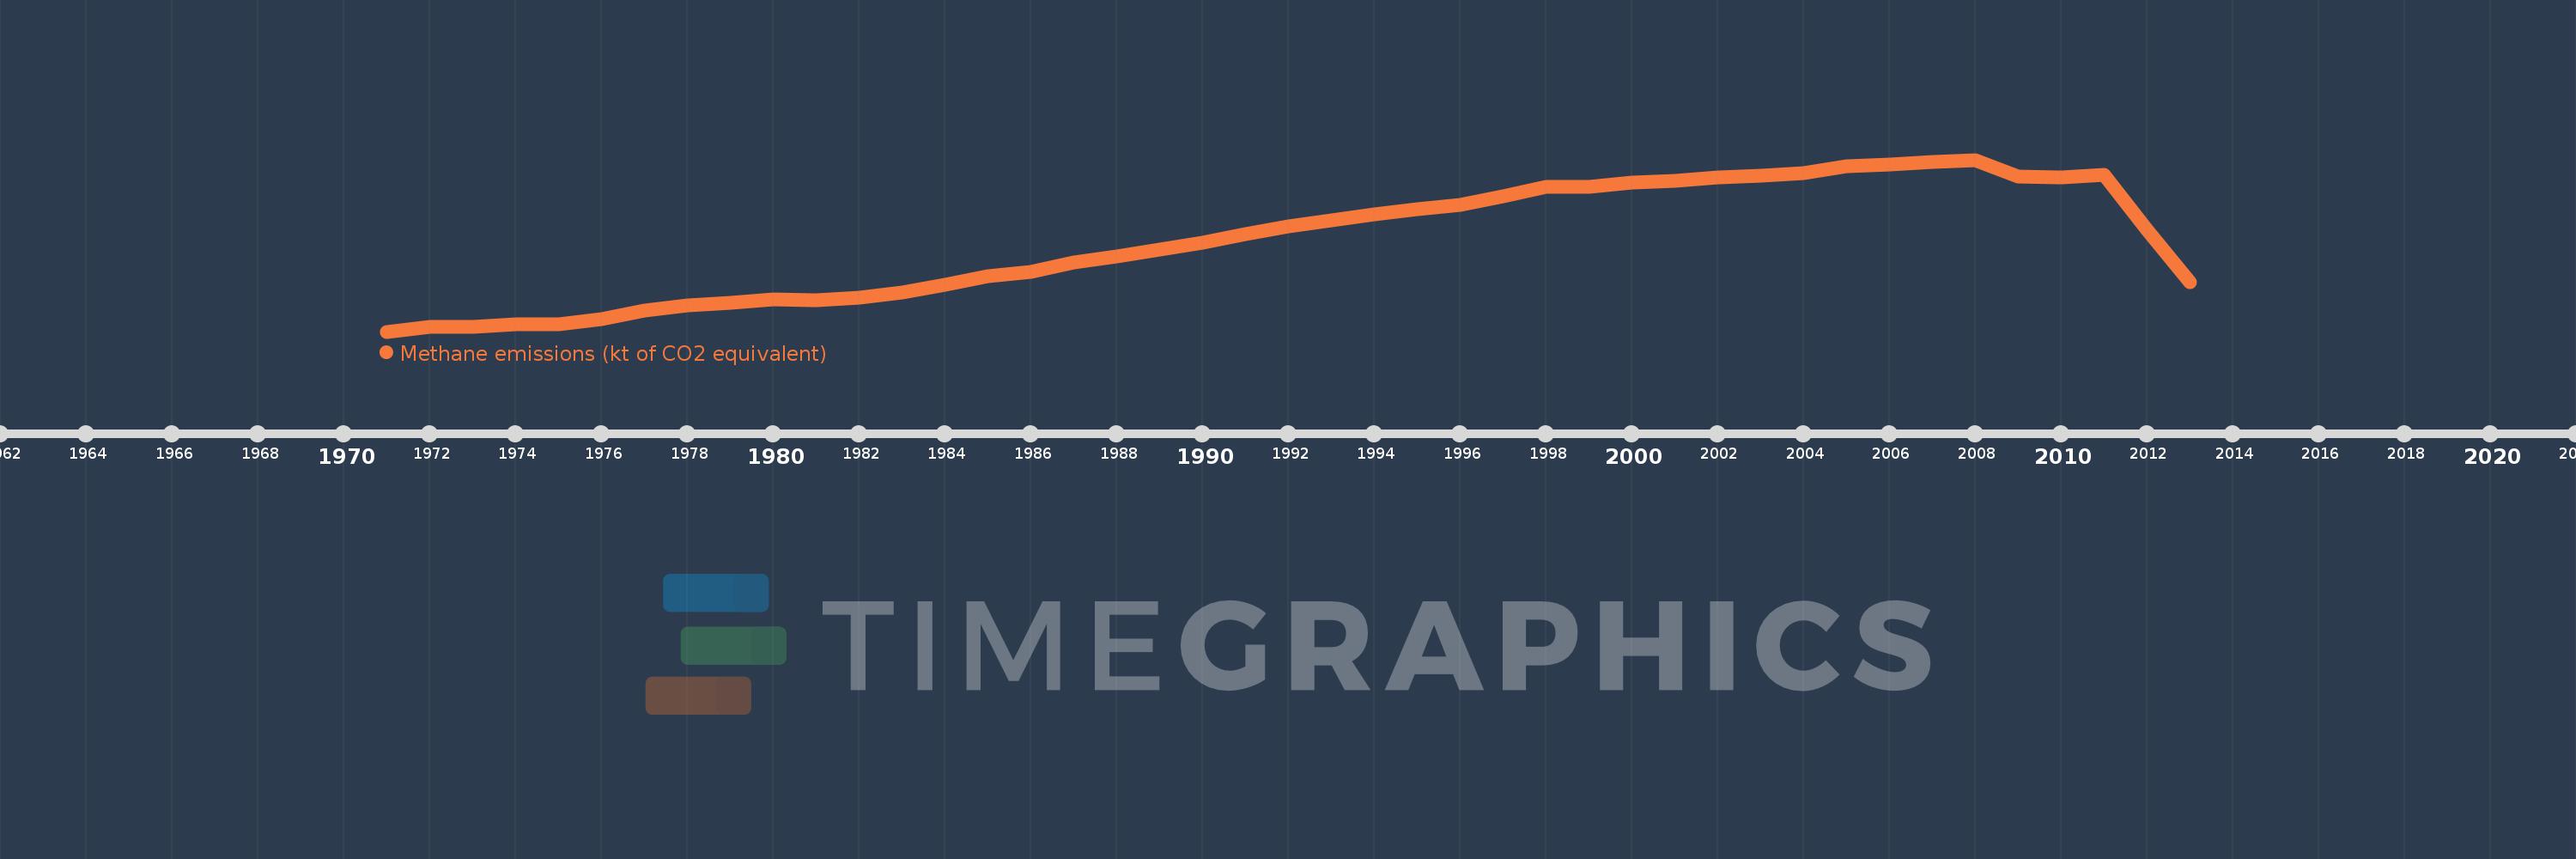
Methane emissions (kt of CO2 equivalent)
2013,2012,2011,2010,2009,2008,2007,2006,2005,2004,2003,2002,2001,2000,1999,1998,1997,1996,1995,1994,1993,1992,1991,1990,1989,1988,1987,1986,1985,1984,1983,1982,1981,1980,1979,1978,1977,1976,1975,1974,1973,1972,1971
This statistics in other country:
AfghanistanAlbaniaAlgeriaAmerican SamoaAngolaAntigua and BarbudaArab WorldArgentinaArmeniaArubaAustraliaAustriaAzerbaijanBahamas, TheBahrainBangladeshBarbadosBelarusBelgiumBelizeBeninBermudaBhutanBoliviaBosnia and HerzegovinaBotswanaBrazilBritish Virgin IslandsBrunei DarussalamBulgariaBurkina FasoBurundiCabo VerdeCambodiaCameroonCanadaCaribbean small statesCayman IslandsCentral African RepublicCentral Europe and the BalticsChadChileChinaColombiaComorosCongo, Dem. Rep.Congo, Rep.Costa RicaCote d'IvoireCroatiaCubaCyprusCzech RepublicDenmarkDjiboutiDominicaDominican RepublicEarly-demographic dividendEast Asia & PacificEast Asia & Pacific (excluding high income)East Asia & Pacific (IDA & IBRD countries)EcuadorEgypt, Arab Rep.El SalvadorEquatorial GuineaEritreaEstoniaEthiopiaEuro areaEurope & Central AsiaEurope & Central Asia (excluding high income)Europe & Central Asia (IDA & IBRD countries)European UnionFaroe IslandsFijiFinlandFragile and conflict affected situationsFranceFrench PolynesiaGabonGambia, TheGeorgiaGermanyGhanaGibraltarGreeceGreenlandGrenadaGuamGuatemalaGuineaGuinea-BissauGuyanaHaitiHeavily indebted poor countries (HIPC)High incomeHondurasHong Kong SAR, ChinaHungaryIBRD onlyIcelandIDA & IBRD totalIDA blendIDA onlyIDA totalIndiaIndonesiaIran, Islamic Rep.IraqIrelandIsraelItalyJamaicaJapanJordanKazakhstanKenyaKiribatiKorea, Dem. People’s Rep.Korea, Rep.KosovoKuwaitKyrgyz RepublicLao PDRLate-demographic dividendLatin America & Caribbean Latin America & Caribbean (excluding high income)Latin America & the Caribbean (IDA & IBRD countries)LatviaLeast developed countries: UN classificationLebanonLesothoLiberiaLibyaLithuaniaLow & middle incomeLow incomeLower middle incomeLuxembourgMacao SAR, ChinaMacedonia, FYRMadagascarMalawiMalaysiaMaldivesMaliMaltaMarshall IslandsMauritaniaMauritiusMexicoMicronesia, Fed. Sts.Middle East & North AfricaMiddle East & North Africa (excluding high income)Middle East & North Africa (IDA & IBRD countries)Middle incomeMoldovaMongoliaMontenegroMoroccoMozambiqueMyanmarNamibiaNauruNepalNetherlandsNew CaledoniaNew ZealandNicaraguaNigerNigeriaNorth AmericaNorthern Mariana IslandsNorwayOECD membersOmanOther small statesPacific island small statesPakistanPalauPanamaPapua New GuineaParaguayPeruPhilippinesPolandPortugalPost-demographic dividendPre-demographic dividendPuerto RicoQatarRomaniaRussian FederationRwandaSamoaSao Tome and PrincipeSaudi ArabiaSenegalSerbiaSeychellesSierra LeoneSingaporeSlovak RepublicSloveniaSmall statesSolomon IslandsSomaliaSouth AfricaSouth AsiaSouth Asia (IDA & IBRD)SpainSri LankaSt. Kitts and NevisSt. LuciaSt. Vincent and the GrenadinesSub-Saharan Africa Sub-Saharan Africa (excluding high income)Sub-Saharan Africa (IDA & IBRD countries)SudanSurinameSwazilandSwedenSwitzerlandSyrian Arab RepublicTajikistanTanzaniaThailandTimor-LesteTogoTongaTrinidad and TobagoTunisiaTurkeyTurkmenistanTurks and Caicos IslandsTuvaluUgandaUkraineUnited Arab EmiratesUnited KingdomUnited StatesUpper middle incomeUruguayUzbekistanVanuatuVenezuela, RBVietnamVirgin Islands (U.S.)WorldYemen, Rep.ZambiaZimbabwe Timeline:
This timeline shows a graph from 1971 to 2013 of Malta. No data until 1970. Number of actual observations by date: 43.
Source name:
World Development Indicators
Source organization:
European Commission, Joint Research Centre (JRC)/Netherlands Environmental Assessment Agency (PBL). Emission Database for Global Atmospheric Research (EDGAR): http://edgar.jrc.ec.europa.eu/
Categories, topics:
Climate Change, Environment
Last updated:
apr 23, 2017
Indicators value changes by year
Minimum:
97.592
jan 1, 1971
Maximum:
248.802
jan 1, 2008
At the date of observation
Value
Absolute change
Change from previous value
jan 1, 1971
97.592
+97.592
0.0%
jan 1, 1972
101.823
+4.231
4.34%
jan 1, 1973
101.445
-0.378
-0.37%
jan 1, 1974
103.685
+2.24
2.21%
jan 1, 1975
104.286
+0.601
0.58%
jan 1, 1976
108.442
+4.156
3.99%
jan 1, 1977
116.387
+7.945
7.33%
jan 1, 1978
120.84
+4.453
3.83%
jan 1, 1979
123.155
+2.315
1.92%
jan 1, 1980
125.773
+2.618
2.13%
jan 1, 1981
125.556
-0.217
-0.17%
jan 1, 1982
127.533
+1.977
1.57%
jan 1, 1983
131.914
+4.381
3.44%
jan 1, 1984
138.623
+6.709
5.09%
jan 1, 1985
146.082
+7.459
5.38%
jan 1, 1986
150.5
+4.418
3.02%
jan 1, 1987
158.347
+7.847
5.21%
jan 1, 1988
164.01
+5.663
3.58%
jan 1, 1989
169.947
+5.937
3.62%
jan 1, 1990
175.996
+6.049
3.56%
jan 1, 1991
183.403
+7.407
4.21%
jan 1, 1992
190.267
+6.864
3.74%
jan 1, 1993
195.606
+5.339
2.81%
jan 1, 1994
201.036
+5.43
2.78%
jan 1, 1995
204.982
+3.946
1.96%
jan 1, 1996
209.257
+4.275
2.09%
jan 1, 1997
217.008
+7.751
3.7%
jan 1, 1998
225.205
+8.197
3.78%
jan 1, 1999
225.183
-0.022
-0.01%
jan 1, 2000
228.749
+3.566
1.58%
jan 1, 2001
230.238
+1.489
0.65%
jan 1, 2002
233.419
+3.181
1.38%
jan 1, 2003
235.167
+1.748
0.75%
jan 1, 2004
237.049
+1.882
0.8%
jan 1, 2005
242.839
+5.79
2.44%
jan 1, 2006
244.332
+1.493
0.61%
jan 1, 2007
247.165
+2.833
1.16%
jan 1, 2008
248.802
+1.637
0.66%
jan 1, 2009
234.124
-14.678
-5.9%
jan 1, 2010
233.673
-0.451
-0.19%
jan 1, 2011
235.227
+1.554
0.67%
jan 1, 2012
187.308
-47.919
-20.37%
jan 1, 2013
140.943
-46.365
-24.75%
Ranking of countries by current statistics by years


Comments: