29
/
en
AIzaSyAYiBZKx7MnpbEhh9jyipgxe19OcubqV5w
April 1, 2024
252140
St. Vincent and the Grenadines
VCT
true
2
1
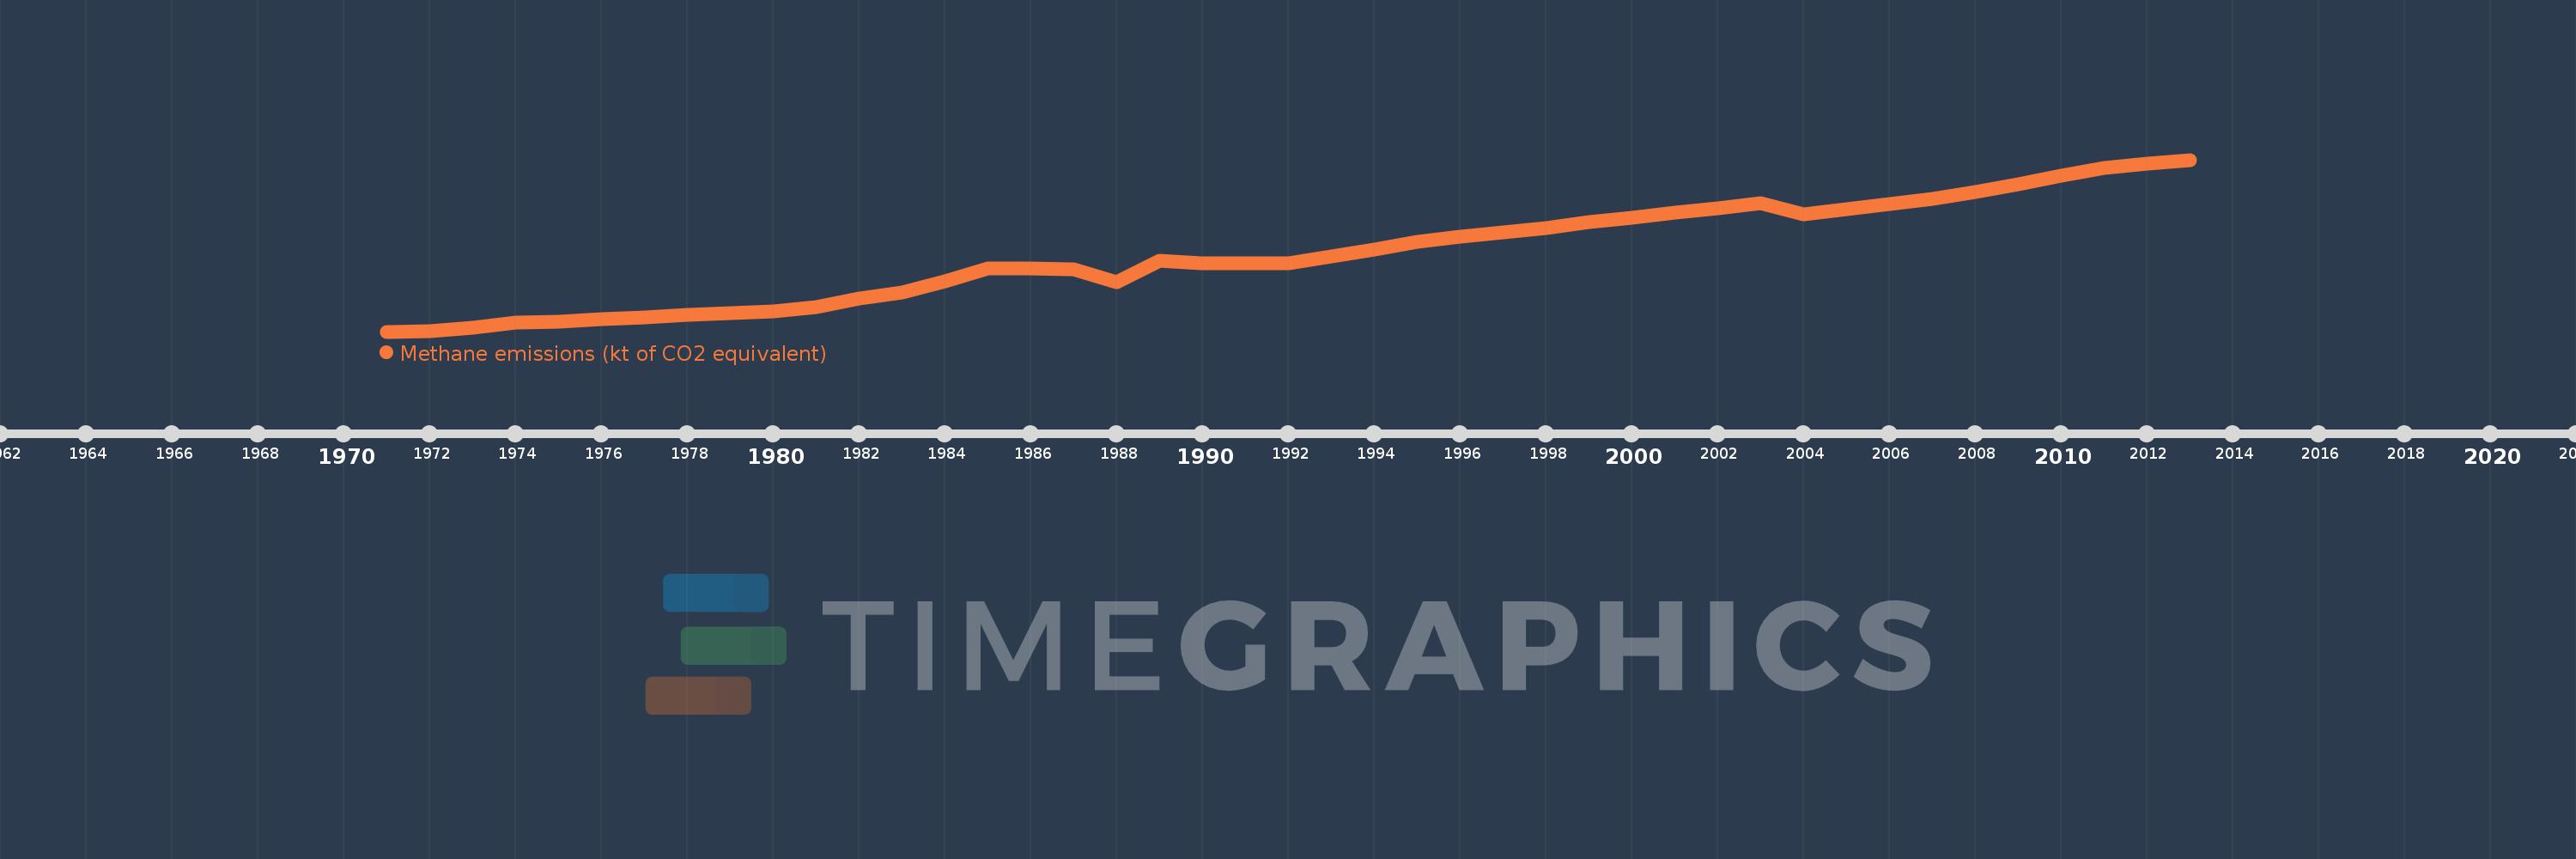
Methane emissions (kt of CO2 equivalent)
2013,2012,2011,2010,2009,2008,2007,2006,2005,2004,2003,2002,2001,2000,1999,1998,1997,1996,1995,1994,1993,1992,1991,1990,1989,1988,1987,1986,1985,1984,1983,1982,1981,1980,1979,1978,1977,1976,1975,1974,1973,1972,1971
This statistics in other country:
AfghanistanAlbaniaAlgeriaAmerican SamoaAngolaAntigua and BarbudaArab WorldArgentinaArmeniaArubaAustraliaAustriaAzerbaijanBahamas, TheBahrainBangladeshBarbadosBelarusBelgiumBelizeBeninBermudaBhutanBoliviaBosnia and HerzegovinaBotswanaBrazilBritish Virgin IslandsBrunei DarussalamBulgariaBurkina FasoBurundiCabo VerdeCambodiaCameroonCanadaCaribbean small statesCayman IslandsCentral African RepublicCentral Europe and the BalticsChadChileChinaColombiaComorosCongo, Dem. Rep.Congo, Rep.Costa RicaCote d'IvoireCroatiaCubaCyprusCzech RepublicDenmarkDjiboutiDominicaDominican RepublicEarly-demographic dividendEast Asia & PacificEast Asia & Pacific (excluding high income)East Asia & Pacific (IDA & IBRD countries)EcuadorEgypt, Arab Rep.El SalvadorEquatorial GuineaEritreaEstoniaEthiopiaEuro areaEurope & Central AsiaEurope & Central Asia (excluding high income)Europe & Central Asia (IDA & IBRD countries)European UnionFaroe IslandsFijiFinlandFragile and conflict affected situationsFranceFrench PolynesiaGabonGambia, TheGeorgiaGermanyGhanaGibraltarGreeceGreenlandGrenadaGuamGuatemalaGuineaGuinea-BissauGuyanaHaitiHeavily indebted poor countries (HIPC)High incomeHondurasHong Kong SAR, ChinaHungaryIBRD onlyIcelandIDA & IBRD totalIDA blendIDA onlyIDA totalIndiaIndonesiaIran, Islamic Rep.IraqIrelandIsraelItalyJamaicaJapanJordanKazakhstanKenyaKiribatiKorea, Dem. People’s Rep.Korea, Rep.KosovoKuwaitKyrgyz RepublicLao PDRLate-demographic dividendLatin America & Caribbean Latin America & Caribbean (excluding high income)Latin America & the Caribbean (IDA & IBRD countries)LatviaLeast developed countries: UN classificationLebanonLesothoLiberiaLibyaLithuaniaLow & middle incomeLow incomeLower middle incomeLuxembourgMacao SAR, ChinaMacedonia, FYRMadagascarMalawiMalaysiaMaldivesMaliMaltaMarshall IslandsMauritaniaMauritiusMexicoMicronesia, Fed. Sts.Middle East & North AfricaMiddle East & North Africa (excluding high income)Middle East & North Africa (IDA & IBRD countries)Middle incomeMoldovaMongoliaMontenegroMoroccoMozambiqueMyanmarNamibiaNauruNepalNetherlandsNew CaledoniaNew ZealandNicaraguaNigerNigeriaNorth AmericaNorthern Mariana IslandsNorwayOECD membersOmanOther small statesPacific island small statesPakistanPalauPanamaPapua New GuineaParaguayPeruPhilippinesPolandPortugalPost-demographic dividendPre-demographic dividendPuerto RicoQatarRomaniaRussian FederationRwandaSamoaSao Tome and PrincipeSaudi ArabiaSenegalSerbiaSeychellesSierra LeoneSingaporeSlovak RepublicSloveniaSmall statesSolomon IslandsSomaliaSouth AfricaSouth AsiaSouth Asia (IDA & IBRD)SpainSri LankaSt. Kitts and NevisSt. LuciaSt. Vincent and the GrenadinesSub-Saharan Africa Sub-Saharan Africa (excluding high income)Sub-Saharan Africa (IDA & IBRD countries)SudanSurinameSwazilandSwedenSwitzerlandSyrian Arab RepublicTajikistanTanzaniaThailandTimor-LesteTogoTongaTrinidad and TobagoTunisiaTurkeyTurkmenistanTurks and Caicos IslandsTuvaluUgandaUkraineUnited Arab EmiratesUnited KingdomUnited StatesUpper middle incomeUruguayUzbekistanVanuatuVenezuela, RBVietnamVirgin Islands (U.S.)WorldYemen, Rep.ZambiaZimbabwe Timeline:
This timeline shows a graph from 1971 to 2013 of St. Vincent and the Grenadines. No data until 1970. Number of actual observations by date: 43.
Source name:
World Development Indicators
Source organization:
European Commission, Joint Research Centre (JRC)/Netherlands Environmental Assessment Agency (PBL). Emission Database for Global Atmospheric Research (EDGAR): http://edgar.jrc.ec.europa.eu/
Categories, topics:
Climate Change, Environment
Last updated:
apr 23, 2017
Indicators value changes by year
Minimum:
23.025
jan 1, 1971
Maximum:
39.865
jan 1, 2013
At the date of observation
Value
Absolute change
Change from previous value
jan 1, 1971
23.025
+23.025
0.0%
jan 1, 1972
23.075
+0.049
0.21%
jan 1, 1973
23.392
+0.318
1.38%
jan 1, 1974
23.897
+0.504
2.16%
jan 1, 1975
24.033
+0.137
0.57%
jan 1, 1976
24.226
+0.193
0.8%
jan 1, 1977
24.384
+0.157
0.65%
jan 1, 1978
24.658
+0.274
1.12%
jan 1, 1979
24.863
+0.206
0.83%
jan 1, 1980
25.043
+0.179
0.72%
jan 1, 1981
25.462
+0.419
1.68%
jan 1, 1982
26.244
+0.782
3.07%
jan 1, 1983
26.884
+0.64
2.44%
jan 1, 1984
27.929
+1.046
3.89%
jan 1, 1985
29.255
+1.326
4.75%
jan 1, 1986
29.174
-0.082
-0.28%
jan 1, 1987
29.11
-0.064
-0.22%
jan 1, 1988
27.885
-1.225
-4.21%
jan 1, 1989
29.939
+2.054
7.37%
jan 1, 1990
29.733
-0.206
-0.69%
jan 1, 1991
29.722
-0.011
-0.04%
jan 1, 1992
29.714
-0.008
-0.03%
jan 1, 1993
30.428
+0.714
2.4%
jan 1, 1994
31.068
+0.64
2.1%
jan 1, 1995
31.802
+0.734
2.36%
jan 1, 1996
32.344
+0.542
1.7%
jan 1, 1997
32.787
+0.443
1.37%
jan 1, 1998
33.2
+0.413
1.26%
jan 1, 1999
33.745
+0.546
1.64%
jan 1, 2000
34.215
+0.47
1.39%
jan 1, 2001
34.652
+0.437
1.28%
jan 1, 2002
35.091
+0.439
1.27%
jan 1, 2003
35.621
+0.53
1.51%
jan 1, 2004
34.544
-1.077
-3.02%
jan 1, 2005
34.993
+0.448
1.3%
jan 1, 2006
35.529
+0.537
1.53%
jan 1, 2007
36.068
+0.538
1.52%
jan 1, 2008
36.721
+0.653
1.81%
jan 1, 2009
37.435
+0.714
1.94%
jan 1, 2010
38.337
+0.902
2.41%
jan 1, 2011
39.083
+0.746
1.95%
jan 1, 2012
39.474
+0.391
1.0%
jan 1, 2013
39.865
+0.391
0.99%
Ranking of countries by current statistics by years


Comments: