29
/
en
AIzaSyAYiBZKx7MnpbEhh9jyipgxe19OcubqV5w
April 1, 2024
166450
Kazakhstan
KAZ
true
2
1
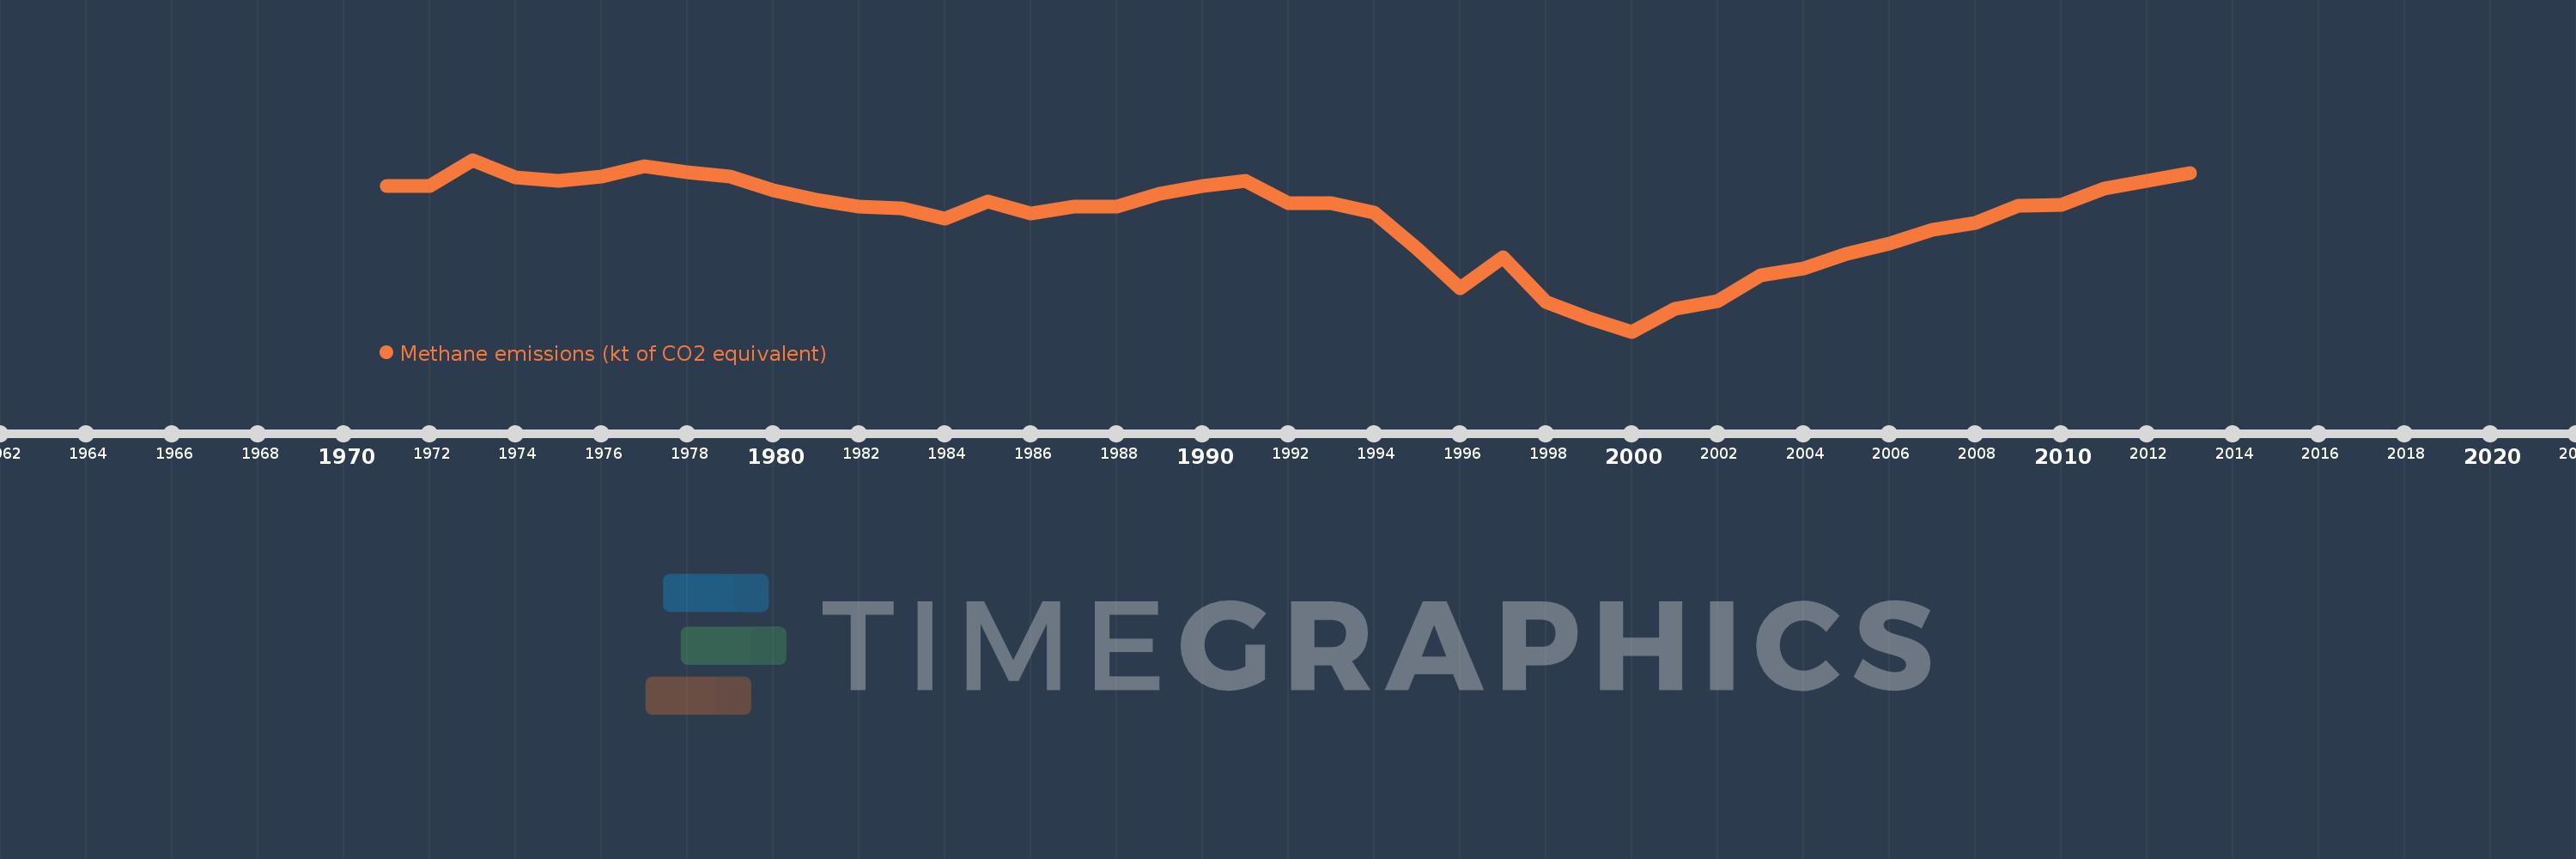
Methane emissions (kt of CO2 equivalent)
2013,2012,2011,2010,2009,2008,2007,2006,2005,2004,2003,2002,2001,2000,1999,1998,1997,1996,1995,1994,1993,1992,1991,1990,1989,1988,1987,1986,1985,1984,1983,1982,1981,1980,1979,1978,1977,1976,1975,1974,1973,1972,1971
This statistics in other country:
AfghanistanAlbaniaAlgeriaAmerican SamoaAngolaAntigua and BarbudaArab WorldArgentinaArmeniaArubaAustraliaAustriaAzerbaijanBahamas, TheBahrainBangladeshBarbadosBelarusBelgiumBelizeBeninBermudaBhutanBoliviaBosnia and HerzegovinaBotswanaBrazilBritish Virgin IslandsBrunei DarussalamBulgariaBurkina FasoBurundiCabo VerdeCambodiaCameroonCanadaCaribbean small statesCayman IslandsCentral African RepublicCentral Europe and the BalticsChadChileChinaColombiaComorosCongo, Dem. Rep.Congo, Rep.Costa RicaCote d'IvoireCroatiaCubaCyprusCzech RepublicDenmarkDjiboutiDominicaDominican RepublicEarly-demographic dividendEast Asia & PacificEast Asia & Pacific (excluding high income)East Asia & Pacific (IDA & IBRD countries)EcuadorEgypt, Arab Rep.El SalvadorEquatorial GuineaEritreaEstoniaEthiopiaEuro areaEurope & Central AsiaEurope & Central Asia (excluding high income)Europe & Central Asia (IDA & IBRD countries)European UnionFaroe IslandsFijiFinlandFragile and conflict affected situationsFranceFrench PolynesiaGabonGambia, TheGeorgiaGermanyGhanaGibraltarGreeceGreenlandGrenadaGuamGuatemalaGuineaGuinea-BissauGuyanaHaitiHeavily indebted poor countries (HIPC)High incomeHondurasHong Kong SAR, ChinaHungaryIBRD onlyIcelandIDA & IBRD totalIDA blendIDA onlyIDA totalIndiaIndonesiaIran, Islamic Rep.IraqIrelandIsraelItalyJamaicaJapanJordanKazakhstanKenyaKiribatiKorea, Dem. People’s Rep.Korea, Rep.KosovoKuwaitKyrgyz RepublicLao PDRLate-demographic dividendLatin America & Caribbean Latin America & Caribbean (excluding high income)Latin America & the Caribbean (IDA & IBRD countries)LatviaLeast developed countries: UN classificationLebanonLesothoLiberiaLibyaLithuaniaLow & middle incomeLow incomeLower middle incomeLuxembourgMacao SAR, ChinaMacedonia, FYRMadagascarMalawiMalaysiaMaldivesMaliMaltaMarshall IslandsMauritaniaMauritiusMexicoMicronesia, Fed. Sts.Middle East & North AfricaMiddle East & North Africa (excluding high income)Middle East & North Africa (IDA & IBRD countries)Middle incomeMoldovaMongoliaMontenegroMoroccoMozambiqueMyanmarNamibiaNauruNepalNetherlandsNew CaledoniaNew ZealandNicaraguaNigerNigeriaNorth AmericaNorthern Mariana IslandsNorwayOECD membersOmanOther small statesPacific island small statesPakistanPalauPanamaPapua New GuineaParaguayPeruPhilippinesPolandPortugalPost-demographic dividendPre-demographic dividendPuerto RicoQatarRomaniaRussian FederationRwandaSamoaSao Tome and PrincipeSaudi ArabiaSenegalSerbiaSeychellesSierra LeoneSingaporeSlovak RepublicSloveniaSmall statesSolomon IslandsSomaliaSouth AfricaSouth AsiaSouth Asia (IDA & IBRD)SpainSri LankaSt. Kitts and NevisSt. LuciaSt. Vincent and the GrenadinesSub-Saharan Africa Sub-Saharan Africa (excluding high income)Sub-Saharan Africa (IDA & IBRD countries)SudanSurinameSwazilandSwedenSwitzerlandSyrian Arab RepublicTajikistanTanzaniaThailandTimor-LesteTogoTongaTrinidad and TobagoTunisiaTurkeyTurkmenistanTurks and Caicos IslandsTuvaluUgandaUkraineUnited Arab EmiratesUnited KingdomUnited StatesUpper middle incomeUruguayUzbekistanVanuatuVenezuela, RBVietnamVirgin Islands (U.S.)WorldYemen, Rep.ZambiaZimbabwe Timeline:
This timeline shows a graph from 1971 to 2013 of Kazakhstan. No data until 1970. Number of actual observations by date: 43.
Source name:
World Development Indicators
Source organization:
European Commission, Joint Research Centre (JRC)/Netherlands Environmental Assessment Agency (PBL). Emission Database for Global Atmospheric Research (EDGAR): http://edgar.jrc.ec.europa.eu/
Categories, topics:
Climate Change, Environment
Last updated:
apr 23, 2017
Indicators value changes by year
Minimum:
33.252K
jan 1, 2000
Maximum:
74.529K
jan 1, 1973
At the date of observation
Value
Absolute change
Change from previous value
jan 1, 1971
68.238K
+68.238K
0.0%
jan 1, 1972
68.301K
+62.5
0.09%
jan 1, 1973
74.529K
+6.229K
9.12%
jan 1, 1974
70.383K
-4.147K
-5.56%
jan 1, 1975
69.54K
-843.4
-1.2%
jan 1, 1976
70.525K
+986.0
1.42%
jan 1, 1977
72.989K
+2.463K
3.49%
jan 1, 1978
71.435K
-1.554K
-2.13%
jan 1, 1979
70.521K
-913.9
-1.28%
jan 1, 1980
67.218K
-3.303K
-4.68%
jan 1, 1981
64.912K
-2.306K
-3.43%
jan 1, 1982
63.225K
-1.687K
-2.6%
jan 1, 1983
62.883K
-342.0
-0.54%
jan 1, 1984
60.438K
-2.445K
-3.89%
jan 1, 1985
64.568K
+4.13K
6.83%
jan 1, 1986
61.601K
-2.967K
-4.6%
jan 1, 1987
63.331K
+1.73K
2.81%
jan 1, 1988
63.247K
-84.1
-0.13%
jan 1, 1989
66.336K
+3.089K
4.88%
jan 1, 1990
68.321K
+1.985K
2.99%
jan 1, 1991
69.412K
+1.091K
1.6%
jan 1, 1992
64.203K
-5.21K
-7.51%
jan 1, 1993
64.059K
-143.3
-0.22%
jan 1, 1994
61.927K
-2.132K
-3.33%
jan 1, 1995
53.121K
-8.806K
-14.22%
jan 1, 1996
43.664K
-9.456K
-17.8%
jan 1, 1997
51.003K
+7.338K
16.81%
jan 1, 1998
40.285K
-10.718K
-21.01%
jan 1, 1999
36.541K
-3.744K
-9.29%
jan 1, 2000
33.252K
-3.288K
-9.0%
jan 1, 2001
38.779K
+5.526K
16.62%
jan 1, 2002
40.549K
+1.77K
4.57%
jan 1, 2003
46.806K
+6.256K
15.43%
jan 1, 2004
48.474K
+1.668K
3.56%
jan 1, 2005
52.018K
+3.545K
7.31%
jan 1, 2006
54.343K
+2.325K
4.47%
jan 1, 2007
57.613K
+3.27K
6.02%
jan 1, 2008
59.419K
+1.805K
3.13%
jan 1, 2009
63.557K
+4.139K
6.97%
jan 1, 2010
63.765K
+207.7
0.33%
jan 1, 2011
67.542K
+3.777K
5.92%
jan 1, 2012
69.446K
+1.904K
2.82%
jan 1, 2013
71.35K
+1.904K
2.74%
Ranking of countries by current statistics by years


Comments: