29
/pt/
pt
AIzaSyAYiBZKx7MnpbEhh9jyipgxe19OcubqV5w
April 1, 2024
99319
Cambodia
KHM
true
2
1
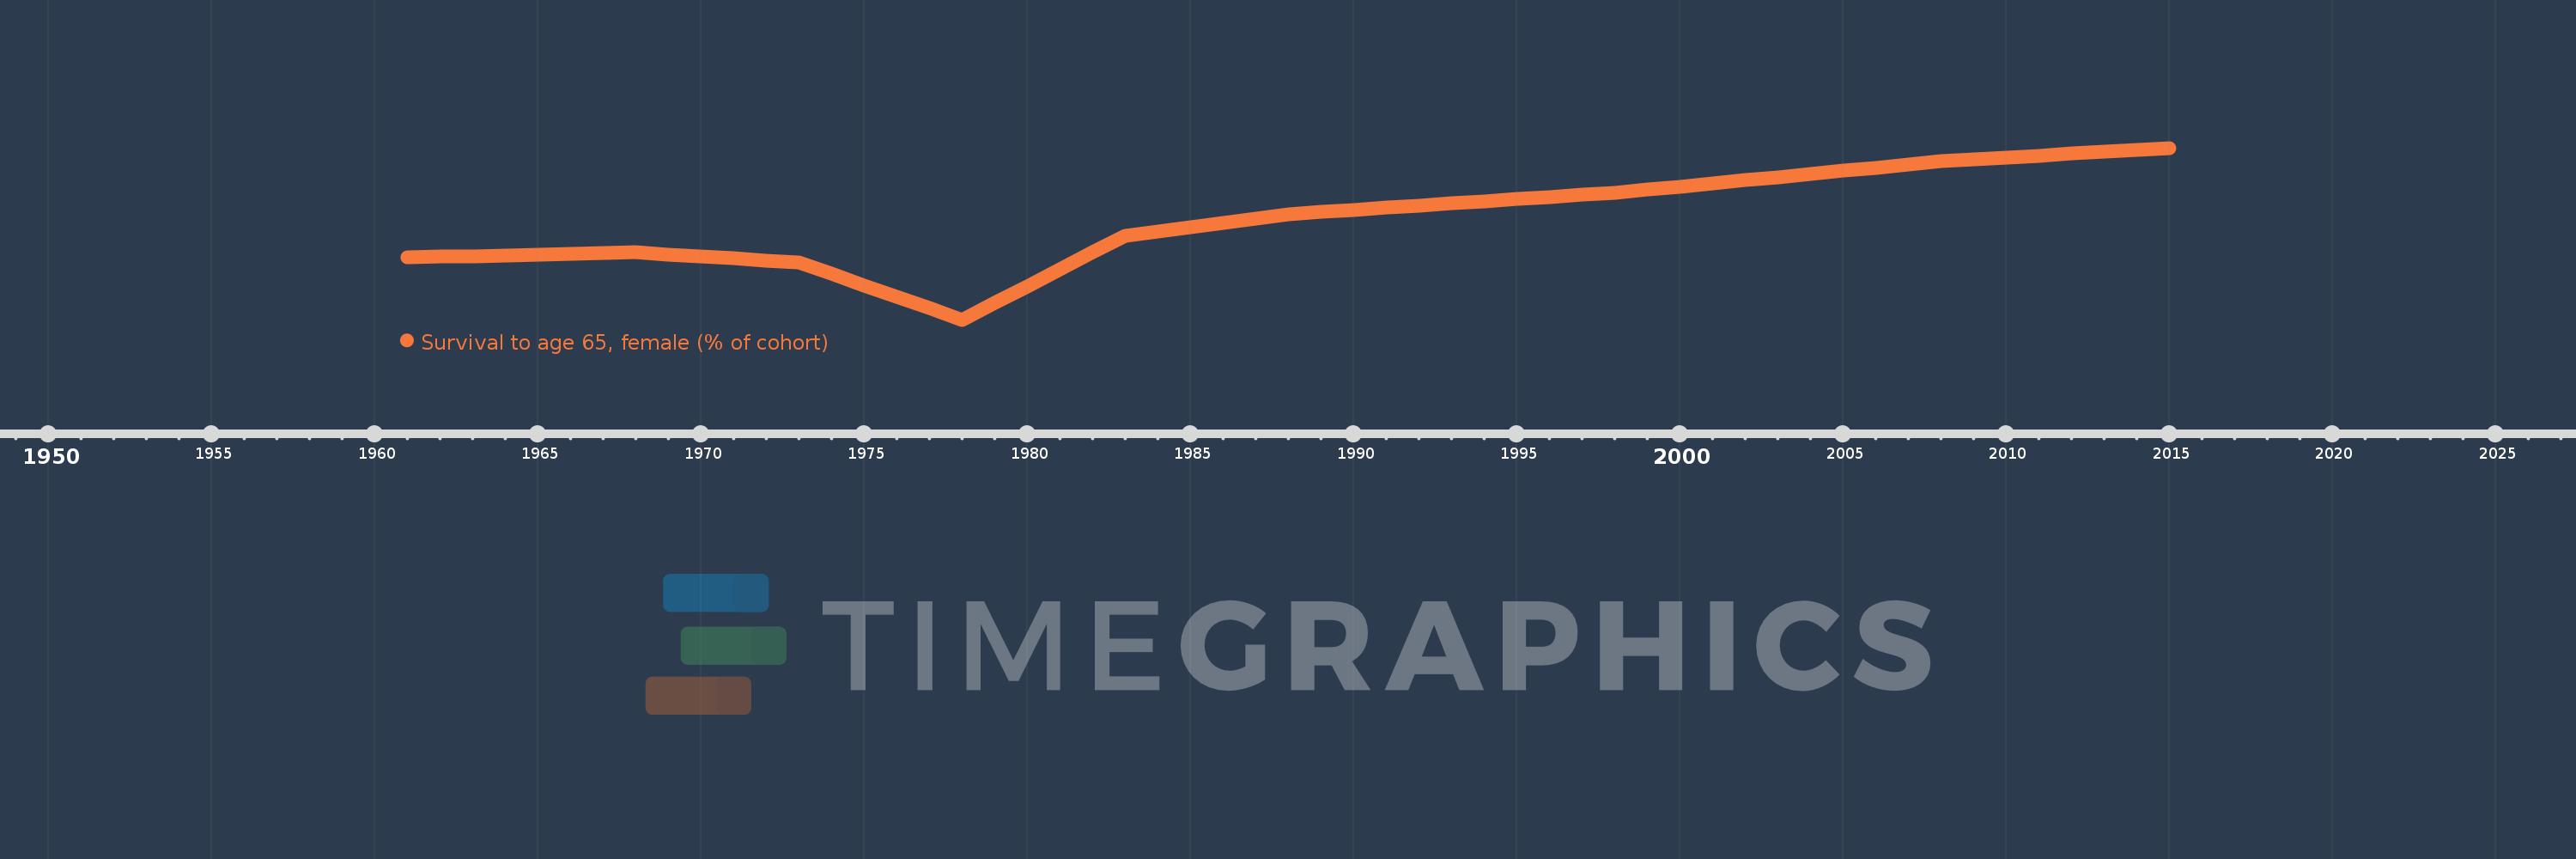
Survival to age 65, female (% of cohort)
2015,2014,2013,2012,2011,2010,2009,2008,2007,2006,2005,2004,2003,2002,2001,2000,1999,1998,1997,1996,1995,1994,1993,1992,1991,1990,1989,1988,1987,1986,1985,1984,1983,1982,1981,1980,1979,1978,1977,1976,1975,1974,1973,1972,1971,1970,1969,1968,1967,1966,1965,1964,1963,1962,1961
Estas estatísticas em outros países:
AfghanistanAlbaniaAlgeriaAngolaAntigua and BarbudaArab WorldArgentinaArmeniaArubaAustraliaAustriaAzerbaijanBahamas, TheBahrainBangladeshBarbadosBelarusBelgiumBelizeBeninBhutanBoliviaBosnia and HerzegovinaBotswanaBrazilBrunei DarussalamBulgariaBurkina FasoBurundiCabo VerdeCambodiaCameroonCanadaCaribbean small statesCentral African RepublicCentral Europe and the BalticsChadChannel IslandsChileChinaColombiaComorosCongo, Dem. Rep.Congo, Rep.Costa RicaCote d'IvoireCroatiaCubaCuracaoCyprusCzech RepublicDenmarkDjiboutiDominican RepublicEarly-demographic dividendEast Asia & PacificEast Asia & Pacific (excluding high income)East Asia & Pacific (IDA & IBRD countries)EcuadorEgypt, Arab Rep.El SalvadorEquatorial GuineaEritreaEstoniaEthiopiaEuro areaEurope & Central AsiaEurope & Central Asia (excluding high income)Europe & Central Asia (IDA & IBRD countries)European UnionFijiFinlandFragile and conflict affected situationsFranceFrench PolynesiaGabonGambia, TheGeorgiaGermanyGhanaGreeceGrenadaGuamGuatemalaGuineaGuinea-BissauGuyanaHaitiHeavily indebted poor countries (HIPC)High incomeHondurasHong Kong SAR, ChinaHungaryIBRD onlyIcelandIDA & IBRD totalIDA blendIDA onlyIDA totalIndiaIndonesiaIran, Islamic Rep.IraqIrelandIsraelItalyJamaicaJapanJordanKazakhstanKenyaKiribatiKorea, Dem. People’s Rep.Korea, Rep.KuwaitKyrgyz RepublicLao PDRLate-demographic dividendLatin America & Caribbean Latin America & Caribbean (excluding high income)Latin America & the Caribbean (IDA & IBRD countries)LatviaLeast developed countries: UN classificationLebanonLesothoLiberiaLibyaLithuaniaLow & middle incomeLow incomeLower middle incomeLuxembourgMacao SAR, ChinaMacedonia, FYRMadagascarMalawiMalaysiaMaldivesMaliMaltaMauritaniaMauritiusMexicoMicronesia, Fed. Sts.Middle East & North AfricaMiddle East & North Africa (excluding high income)Middle East & North Africa (IDA & IBRD countries)Middle incomeMoldovaMongoliaMontenegroMoroccoMozambiqueMyanmarNamibiaNepalNetherlandsNew CaledoniaNew ZealandNicaraguaNigerNigeriaNorth AmericaNorwayOECD membersOmanOther small statesPacific island small statesPakistanPanamaPapua New GuineaParaguayPeruPhilippinesPolandPortugalPost-demographic dividendPre-demographic dividendPuerto RicoQatarRomaniaRussian FederationRwandaSamoaSao Tome and PrincipeSaudi ArabiaSenegalSerbiaSeychellesSierra LeoneSingaporeSlovak RepublicSloveniaSmall statesSolomon IslandsSomaliaSouth AfricaSouth AsiaSouth Asia (IDA & IBRD)South SudanSpainSri LankaSt. LuciaSt. Vincent and the GrenadinesSub-Saharan Africa Sub-Saharan Africa (excluding high income)Sub-Saharan Africa (IDA & IBRD countries)SudanSurinameSwazilandSwedenSwitzerlandSyrian Arab RepublicTajikistanTanzaniaThailandTimor-LesteTogoTongaTrinidad and TobagoTunisiaTurkeyTurkmenistanUgandaUkraineUnited Arab EmiratesUnited KingdomUnited StatesUpper middle incomeUruguayUzbekistanVanuatuVenezuela, RBVietnamVirgin Islands (U.S.)West Bank and GazaWorldYemen, Rep.ZambiaZimbabwe Linha do tempo:
Nesta escala de tempo está apresentado um gráfico de 1961 ano até 2015 ano Cambodia. Dados de 1960 ano ausente. O número de observações reais por data: 55.
Fonte (nome):
Indicadores de desenvolvimento mundial
Fonte (organização):
United Nations Population Division. World Population Prospects. New York, United Nations, Department of Economic and Social Affairs (advanced Excel tables). Available at http://esa.un.org/wpp/unpp/panel_population.htm.
Categorias:
Health, Gender
Foi atualizado:
23 abr 2017 ano
Indicadores de alterações dos valores ao longo dos anos
Mínimo:
6.464
1 jan 1978 ano
Máximo:
75.549
1 jan 2015 ano
Na data de observação
Valor
Mudança absoluta
A alteração em relação ao valor anterior
1 jan 1961 ano
31.551
+31.551
0.0%
1 jan 1962 ano
31.784
+0.233
0.74%
1 jan 1963 ano
32.017
+0.233
0.73%
1 jan 1964 ano
32.316
+0.299
0.93%
1 jan 1965 ano
32.615
+0.299
0.92%
1 jan 1966 ano
32.913
+0.299
0.92%
1 jan 1967 ano
33.212
+0.299
0.91%
1 jan 1968 ano
33.51
+0.299
0.9%
1 jan 1969 ano
32.701
-0.81
-2.42%
1 jan 1970 ano
31.891
-0.81
-2.48%
1 jan 1971 ano
31.082
-0.81
-2.54%
1 jan 1972 ano
30.272
-0.81
-2.6%
1 jan 1973 ano
29.462
-0.81
-2.67%
1 jan 1974 ano
24.863
-4.6
-15.61%
1 jan 1975 ano
20.263
-4.6
-18.5%
1 jan 1976 ano
15.663
-4.6
-22.7%
1 jan 1977 ano
11.064
-4.6
-29.37%
1 jan 1978 ano
6.464
-4.6
-41.58%
1 jan 1979 ano
13.221
+6.757
104.53%
1 jan 1980 ano
19.978
+6.757
51.11%
1 jan 1981 ano
26.735
+6.757
33.82%
1 jan 1982 ano
33.492
+6.757
25.27%
1 jan 1983 ano
40.249
+6.757
20.18%
1 jan 1984 ano
41.979
+1.73
4.3%
1 jan 1985 ano
43.709
+1.73
4.12%
1 jan 1986 ano
45.44
+1.73
3.96%
1 jan 1987 ano
47.17
+1.73
3.81%
1 jan 1988 ano
48.9
+1.73
3.67%
1 jan 1989 ano
49.768
+0.868
1.78%
1 jan 1990 ano
50.637
+0.868
1.74%
1 jan 1991 ano
51.505
+0.868
1.71%
1 jan 1992 ano
52.373
+0.868
1.69%
1 jan 1993 ano
53.241
+0.868
1.66%
1 jan 1994 ano
54.094
+0.853
1.6%
1 jan 1995 ano
54.947
+0.853
1.58%
1 jan 1996 ano
55.8
+0.853
1.55%
1 jan 1997 ano
56.652
+0.853
1.53%
1 jan 1998 ano
57.505
+0.853
1.51%
1 jan 1999 ano
58.754
+1.249
2.17%
1 jan 2000 ano
60.003
+1.249
2.13%
1 jan 2001 ano
61.252
+1.249
2.08%
1 jan 2002 ano
62.501
+1.249
2.04%
1 jan 2003 ano
63.749
+1.249
2.0%
1 jan 2004 ano
65.057
+1.307
2.05%
1 jan 2005 ano
66.364
+1.307
2.01%
1 jan 2006 ano
67.672
+1.307
1.97%
1 jan 2007 ano
68.979
+1.307
1.93%
1 jan 2008 ano
70.287
+1.307
1.9%
1 jan 2009 ano
71.021
+0.735
1.05%
1 jan 2010 ano
71.756
+0.735
1.03%
1 jan 2011 ano
72.491
+0.735
1.02%
1 jan 2012 ano
73.225
+0.735
1.01%
1 jan 2013 ano
73.96
+0.735
1.0%
1 jan 2014 ano
74.754
+0.794
1.07%
1 jan 2015 ano
75.549
+0.795
1.06%
Classificação de países por estatísticas atuais por anos


Comentários: