29
/pt/
pt
AIzaSyAYiBZKx7MnpbEhh9jyipgxe19OcubqV5w
April 1, 2024
229226
Romania
ROU
true
2
1
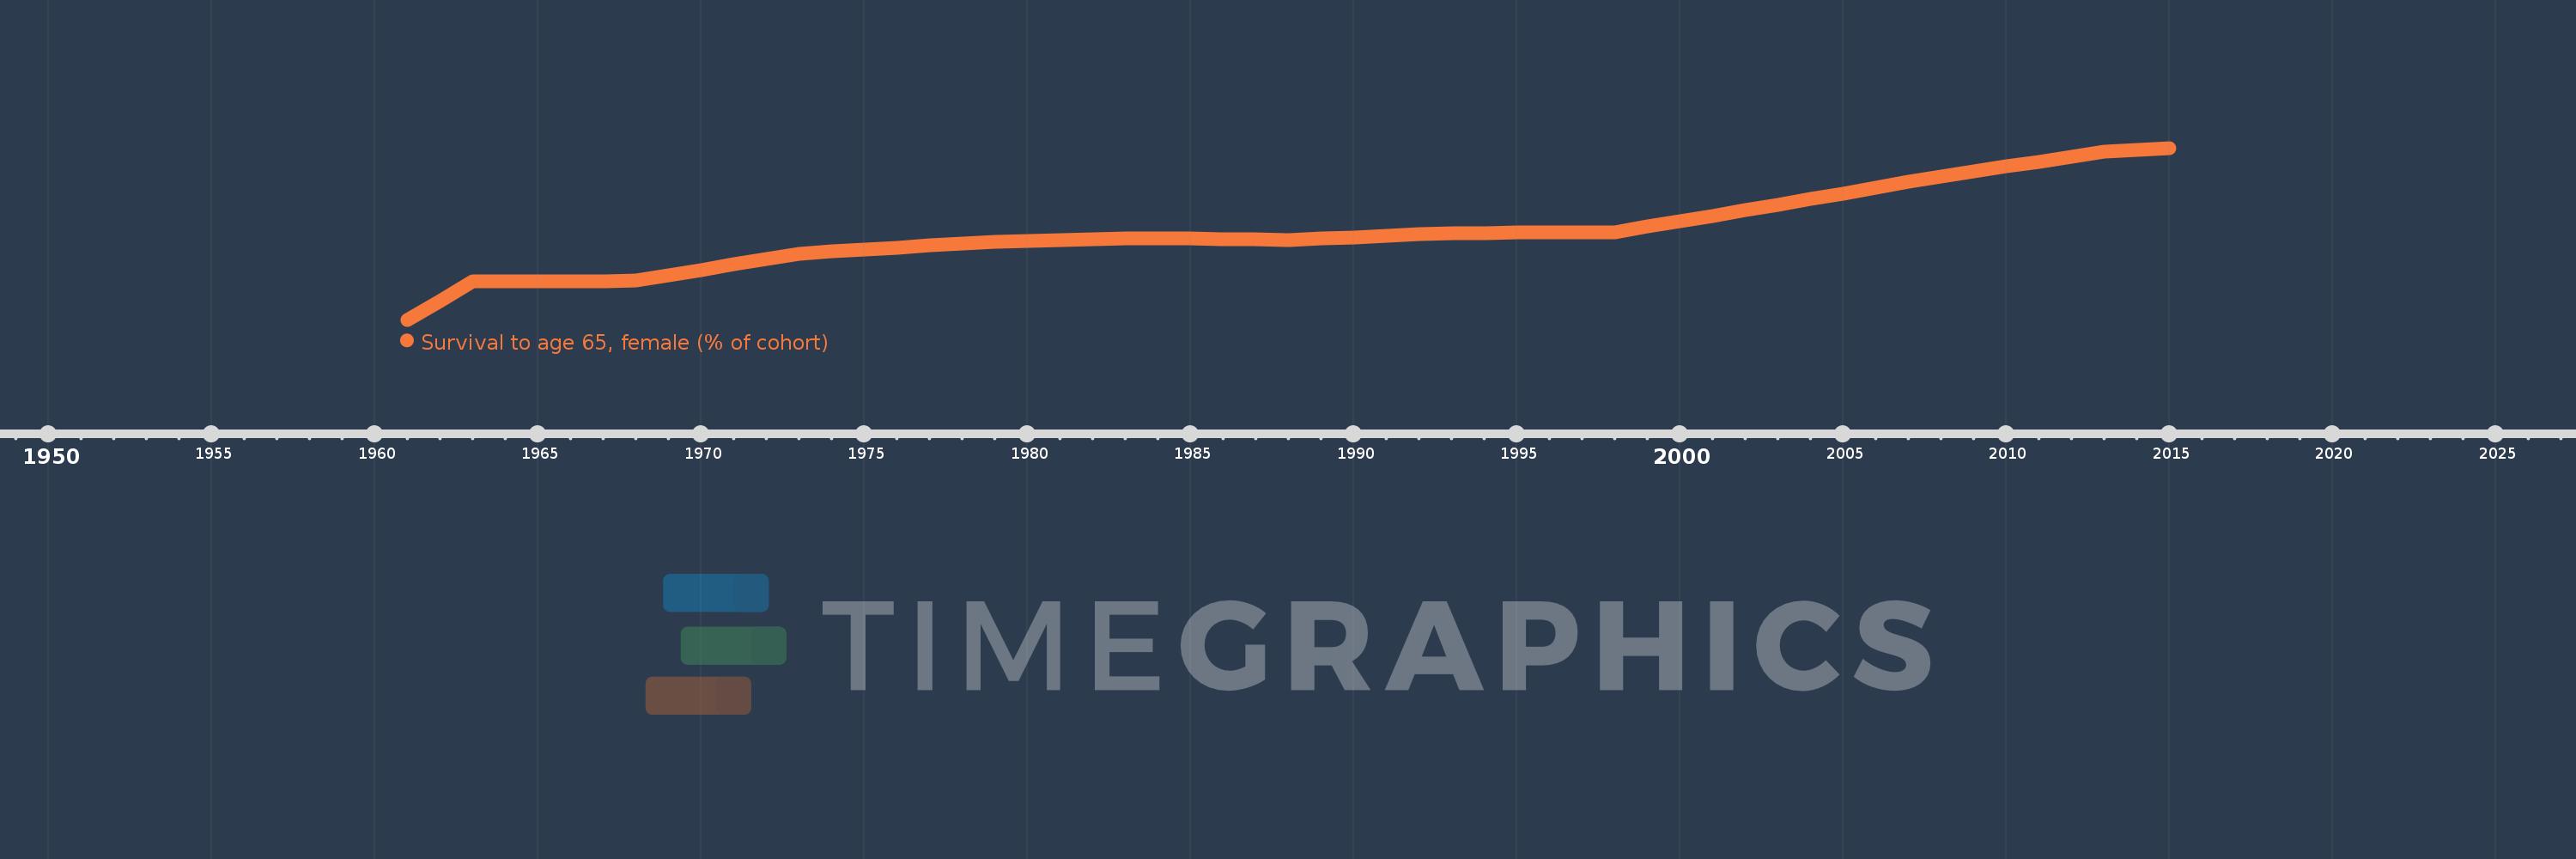
Survival to age 65, female (% of cohort)
2015,2014,2013,2012,2011,2010,2009,2008,2007,2006,2005,2004,2003,2002,2001,2000,1999,1998,1997,1996,1995,1994,1993,1992,1991,1990,1989,1988,1987,1986,1985,1984,1983,1982,1981,1980,1979,1978,1977,1976,1975,1974,1973,1972,1971,1970,1969,1968,1967,1966,1965,1964,1963,1962,1961
Estas estatísticas em outros países:
AfghanistanAlbaniaAlgeriaAngolaAntigua and BarbudaArab WorldArgentinaArmeniaArubaAustraliaAustriaAzerbaijanBahamas, TheBahrainBangladeshBarbadosBelarusBelgiumBelizeBeninBhutanBoliviaBosnia and HerzegovinaBotswanaBrazilBrunei DarussalamBulgariaBurkina FasoBurundiCabo VerdeCambodiaCameroonCanadaCaribbean small statesCentral African RepublicCentral Europe and the BalticsChadChannel IslandsChileChinaColombiaComorosCongo, Dem. Rep.Congo, Rep.Costa RicaCote d'IvoireCroatiaCubaCuracaoCyprusCzech RepublicDenmarkDjiboutiDominican RepublicEarly-demographic dividendEast Asia & PacificEast Asia & Pacific (excluding high income)East Asia & Pacific (IDA & IBRD countries)EcuadorEgypt, Arab Rep.El SalvadorEquatorial GuineaEritreaEstoniaEthiopiaEuro areaEurope & Central AsiaEurope & Central Asia (excluding high income)Europe & Central Asia (IDA & IBRD countries)European UnionFijiFinlandFragile and conflict affected situationsFranceFrench PolynesiaGabonGambia, TheGeorgiaGermanyGhanaGreeceGrenadaGuamGuatemalaGuineaGuinea-BissauGuyanaHaitiHeavily indebted poor countries (HIPC)High incomeHondurasHong Kong SAR, ChinaHungaryIBRD onlyIcelandIDA & IBRD totalIDA blendIDA onlyIDA totalIndiaIndonesiaIran, Islamic Rep.IraqIrelandIsraelItalyJamaicaJapanJordanKazakhstanKenyaKiribatiKorea, Dem. People’s Rep.Korea, Rep.KuwaitKyrgyz RepublicLao PDRLate-demographic dividendLatin America & Caribbean Latin America & Caribbean (excluding high income)Latin America & the Caribbean (IDA & IBRD countries)LatviaLeast developed countries: UN classificationLebanonLesothoLiberiaLibyaLithuaniaLow & middle incomeLow incomeLower middle incomeLuxembourgMacao SAR, ChinaMacedonia, FYRMadagascarMalawiMalaysiaMaldivesMaliMaltaMauritaniaMauritiusMexicoMicronesia, Fed. Sts.Middle East & North AfricaMiddle East & North Africa (excluding high income)Middle East & North Africa (IDA & IBRD countries)Middle incomeMoldovaMongoliaMontenegroMoroccoMozambiqueMyanmarNamibiaNepalNetherlandsNew CaledoniaNew ZealandNicaraguaNigerNigeriaNorth AmericaNorwayOECD membersOmanOther small statesPacific island small statesPakistanPanamaPapua New GuineaParaguayPeruPhilippinesPolandPortugalPost-demographic dividendPre-demographic dividendPuerto RicoQatarRomaniaRussian FederationRwandaSamoaSao Tome and PrincipeSaudi ArabiaSenegalSerbiaSeychellesSierra LeoneSingaporeSlovak RepublicSloveniaSmall statesSolomon IslandsSomaliaSouth AfricaSouth AsiaSouth Asia (IDA & IBRD)South SudanSpainSri LankaSt. LuciaSt. Vincent and the GrenadinesSub-Saharan Africa Sub-Saharan Africa (excluding high income)Sub-Saharan Africa (IDA & IBRD countries)SudanSurinameSwazilandSwedenSwitzerlandSyrian Arab RepublicTajikistanTanzaniaThailandTimor-LesteTogoTongaTrinidad and TobagoTunisiaTurkeyTurkmenistanUgandaUkraineUnited Arab EmiratesUnited KingdomUnited StatesUpper middle incomeUruguayUzbekistanVanuatuVenezuela, RBVietnamVirgin Islands (U.S.)West Bank and GazaWorldYemen, Rep.ZambiaZimbabwe Linha do tempo:
Nesta escala de tempo está apresentado um gráfico de 1961 ano até 2015 ano Romania. Dados de 1960 ano ausente. O número de observações reais por data: 55.
Fonte (nome):
Indicadores de desenvolvimento mundial
Fonte (organização):
United Nations Population Division. World Population Prospects. New York, United Nations, Department of Economic and Social Affairs (advanced Excel tables). Available at http://esa.un.org/wpp/unpp/panel_population.htm.
Categorias:
Health, Gender
Foi atualizado:
23 abr 2017 ano
Indicadores de alterações dos valores ao longo dos anos
Mínimo:
73.378
1 jan 1961 ano
Máximo:
86.927
1 jan 2015 ano
Na data de observação
Valor
Mudança absoluta
A alteração em relação ao valor anterior
1 jan 1961 ano
73.378
+73.378
0.0%
1 jan 1962 ano
74.878
+1.499
2.04%
1 jan 1963 ano
76.377
+1.499
2.0%
1 jan 1964 ano
76.392
+0.015
0.02%
1 jan 1965 ano
76.408
+0.015
0.02%
1 jan 1966 ano
76.423
+0.015
0.02%
1 jan 1967 ano
76.438
+0.015
0.02%
1 jan 1968 ano
76.453
+0.015
0.02%
1 jan 1969 ano
76.878
+0.425
0.56%
1 jan 1970 ano
77.304
+0.425
0.55%
1 jan 1971 ano
77.729
+0.425
0.55%
1 jan 1972 ano
78.154
+0.425
0.55%
1 jan 1973 ano
78.579
+0.425
0.54%
1 jan 1974 ano
78.746
+0.166
0.21%
1 jan 1975 ano
78.912
+0.166
0.21%
1 jan 1976 ano
79.078
+0.166
0.21%
1 jan 1977 ano
79.244
+0.166
0.21%
1 jan 1978 ano
79.41
+0.166
0.21%
1 jan 1979 ano
79.494
+0.083
0.1%
1 jan 1980 ano
79.577
+0.083
0.1%
1 jan 1981 ano
79.66
+0.083
0.1%
1 jan 1982 ano
79.743
+0.083
0.1%
1 jan 1983 ano
79.826
+0.083
0.1%
1 jan 1984 ano
79.796
-0.03
-0.04%
1 jan 1985 ano
79.766
-0.03
-0.04%
1 jan 1986 ano
79.736
-0.03
-0.04%
1 jan 1987 ano
79.706
-0.03
-0.04%
1 jan 1988 ano
79.676
-0.03
-0.04%
1 jan 1989 ano
79.783
+0.106
0.13%
1 jan 1990 ano
79.889
+0.106
0.13%
1 jan 1991 ano
79.996
+0.106
0.13%
1 jan 1992 ano
80.102
+0.106
0.13%
1 jan 1993 ano
80.209
+0.106
0.13%
1 jan 1994 ano
80.225
+0.016
0.02%
1 jan 1995 ano
80.241
+0.016
0.02%
1 jan 1996 ano
80.258
+0.016
0.02%
1 jan 1997 ano
80.274
+0.016
0.02%
1 jan 1998 ano
80.29
+0.016
0.02%
1 jan 1999 ano
80.721
+0.431
0.54%
1 jan 2000 ano
81.151
+0.431
0.53%
1 jan 2001 ano
81.582
+0.431
0.53%
1 jan 2002 ano
82.013
+0.431
0.53%
1 jan 2003 ano
82.443
+0.431
0.53%
1 jan 2004 ano
82.894
+0.45
0.55%
1 jan 2005 ano
83.344
+0.45
0.54%
1 jan 2006 ano
83.794
+0.45
0.54%
1 jan 2007 ano
84.245
+0.45
0.54%
1 jan 2008 ano
84.695
+0.45
0.53%
1 jan 2009 ano
85.081
+0.387
0.46%
1 jan 2010 ano
85.468
+0.387
0.45%
1 jan 2011 ano
85.854
+0.387
0.45%
1 jan 2012 ano
86.241
+0.387
0.45%
1 jan 2013 ano
86.627
+0.387
0.45%
1 jan 2014 ano
86.777
+0.15
0.17%
1 jan 2015 ano
86.927
+0.15
0.17%
Classificação de países por estatísticas atuais por anos


Comentários: