29
/pt/
pt
AIzaSyAYiBZKx7MnpbEhh9jyipgxe19OcubqV5w
April 1, 2024
39574
IDA only
IDX
false
2
1
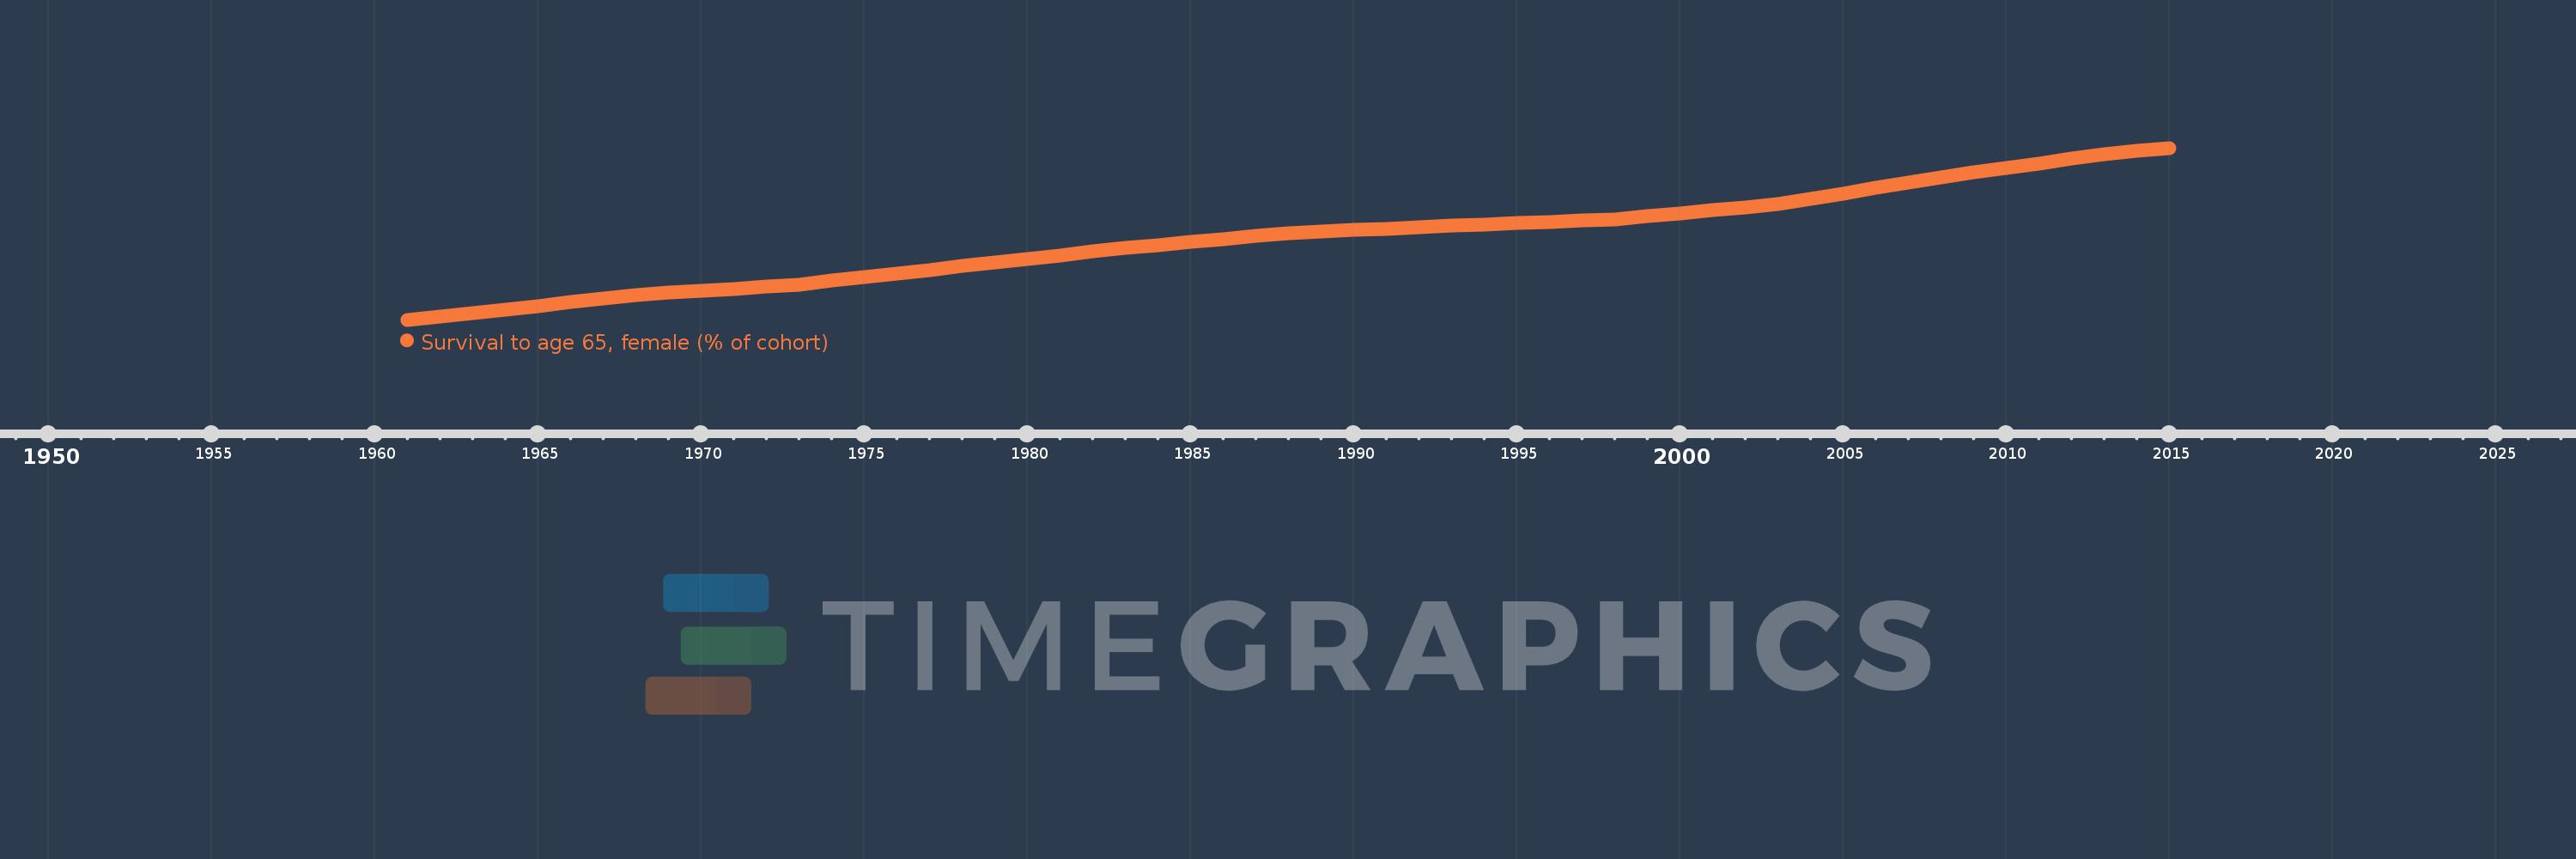
Survival to age 65, female (% of cohort)
2015,2014,2013,2012,2011,2010,2009,2008,2007,2006,2005,2004,2003,2002,2001,2000,1999,1998,1997,1996,1995,1994,1993,1992,1991,1990,1989,1988,1987,1986,1985,1984,1983,1982,1981,1980,1979,1978,1977,1976,1975,1974,1973,1972,1971,1970,1969,1968,1967,1966,1965,1964,1963,1962,1961
Estas estatísticas em outros países:
AfghanistanAlbaniaAlgeriaAngolaAntigua and BarbudaArab WorldArgentinaArmeniaArubaAustraliaAustriaAzerbaijanBahamas, TheBahrainBangladeshBarbadosBelarusBelgiumBelizeBeninBhutanBoliviaBosnia and HerzegovinaBotswanaBrazilBrunei DarussalamBulgariaBurkina FasoBurundiCabo VerdeCambodiaCameroonCanadaCaribbean small statesCentral African RepublicCentral Europe and the BalticsChadChannel IslandsChileChinaColombiaComorosCongo, Dem. Rep.Congo, Rep.Costa RicaCote d'IvoireCroatiaCubaCuracaoCyprusCzech RepublicDenmarkDjiboutiDominican RepublicEarly-demographic dividendEast Asia & PacificEast Asia & Pacific (excluding high income)East Asia & Pacific (IDA & IBRD countries)EcuadorEgypt, Arab Rep.El SalvadorEquatorial GuineaEritreaEstoniaEthiopiaEuro areaEurope & Central AsiaEurope & Central Asia (excluding high income)Europe & Central Asia (IDA & IBRD countries)European UnionFijiFinlandFragile and conflict affected situationsFranceFrench PolynesiaGabonGambia, TheGeorgiaGermanyGhanaGreeceGrenadaGuamGuatemalaGuineaGuinea-BissauGuyanaHaitiHeavily indebted poor countries (HIPC)High incomeHondurasHong Kong SAR, ChinaHungaryIBRD onlyIcelandIDA & IBRD totalIDA blendIDA onlyIDA totalIndiaIndonesiaIran, Islamic Rep.IraqIrelandIsraelItalyJamaicaJapanJordanKazakhstanKenyaKiribatiKorea, Dem. People’s Rep.Korea, Rep.KuwaitKyrgyz RepublicLao PDRLate-demographic dividendLatin America & Caribbean Latin America & Caribbean (excluding high income)Latin America & the Caribbean (IDA & IBRD countries)LatviaLeast developed countries: UN classificationLebanonLesothoLiberiaLibyaLithuaniaLow & middle incomeLow incomeLower middle incomeLuxembourgMacao SAR, ChinaMacedonia, FYRMadagascarMalawiMalaysiaMaldivesMaliMaltaMauritaniaMauritiusMexicoMicronesia, Fed. Sts.Middle East & North AfricaMiddle East & North Africa (excluding high income)Middle East & North Africa (IDA & IBRD countries)Middle incomeMoldovaMongoliaMontenegroMoroccoMozambiqueMyanmarNamibiaNepalNetherlandsNew CaledoniaNew ZealandNicaraguaNigerNigeriaNorth AmericaNorwayOECD membersOmanOther small statesPacific island small statesPakistanPanamaPapua New GuineaParaguayPeruPhilippinesPolandPortugalPost-demographic dividendPre-demographic dividendPuerto RicoQatarRomaniaRussian FederationRwandaSamoaSao Tome and PrincipeSaudi ArabiaSenegalSerbiaSeychellesSierra LeoneSingaporeSlovak RepublicSloveniaSmall statesSolomon IslandsSomaliaSouth AfricaSouth AsiaSouth Asia (IDA & IBRD)South SudanSpainSri LankaSt. LuciaSt. Vincent and the GrenadinesSub-Saharan Africa Sub-Saharan Africa (excluding high income)Sub-Saharan Africa (IDA & IBRD countries)SudanSurinameSwazilandSwedenSwitzerlandSyrian Arab RepublicTajikistanTanzaniaThailandTimor-LesteTogoTongaTrinidad and TobagoTunisiaTurkeyTurkmenistanUgandaUkraineUnited Arab EmiratesUnited KingdomUnited StatesUpper middle incomeUruguayUzbekistanVanuatuVenezuela, RBVietnamVirgin Islands (U.S.)West Bank and GazaWorldYemen, Rep.ZambiaZimbabwe Linha do tempo:
Nesta escala de tempo está apresentado um gráfico de 1961 ano até 2015 ano IDA only. Dados de 1960 ano ausente. O número de observações reais por data: 55.
Fonte (nome):
Indicadores de desenvolvimento mundial
Fonte (organização):
United Nations Population Division. World Population Prospects. New York, United Nations, Department of Economic and Social Affairs (advanced Excel tables). Available at http://esa.un.org/wpp/unpp/panel_population.htm.
Categorias:
Health, Gender
Foi atualizado:
23 abr 2017 ano
Indicadores de alterações dos valores ao longo dos anos
Mínimo:
34.802
1 jan 1961 ano
Máximo:
66.982
1 jan 2015 ano
Na data de observação
Valor
Mudança absoluta
A alteração em relação ao valor anterior
1 jan 1961 ano
34.802
+34.802
0.0%
1 jan 1962 ano
35.44
+0.637
1.83%
1 jan 1963 ano
36.075
+0.636
1.79%
1 jan 1964 ano
36.742
+0.666
1.85%
1 jan 1965 ano
37.407
+0.666
1.81%
1 jan 1966 ano
38.073
+0.666
1.78%
1 jan 1967 ano
38.748
+0.675
1.77%
1 jan 1968 ano
39.424
+0.676
1.74%
1 jan 1969 ano
39.827
+0.403
1.02%
1 jan 1970 ano
40.227
+0.4
1.0%
1 jan 1971 ano
40.623
+0.396
0.98%
1 jan 1972 ano
41.026
+0.403
0.99%
1 jan 1973 ano
41.426
+0.4
0.98%
1 jan 1974 ano
42.102
+0.676
1.63%
1 jan 1975 ano
42.778
+0.675
1.6%
1 jan 1976 ano
43.456
+0.679
1.59%
1 jan 1977 ano
44.153
+0.697
1.6%
1 jan 1978 ano
44.859
+0.706
1.6%
1 jan 1979 ano
45.544
+0.685
1.53%
1 jan 1980 ano
46.224
+0.68
1.49%
1 jan 1981 ano
46.899
+0.675
1.46%
1 jan 1982 ano
47.577
+0.678
1.45%
1 jan 1983 ano
48.253
+0.676
1.42%
1 jan 1984 ano
48.82
+0.566
1.17%
1 jan 1985 ano
49.378
+0.559
1.14%
1 jan 1986 ano
49.928
+0.55
1.11%
1 jan 1987 ano
50.479
+0.551
1.1%
1 jan 1988 ano
51.019
+0.54
1.07%
1 jan 1989 ano
51.301
+0.282
0.55%
1 jan 1990 ano
51.576
+0.275
0.54%
1 jan 1991 ano
51.848
+0.272
0.53%
1 jan 1992 ano
52.138
+0.289
0.56%
1 jan 1993 ano
52.434
+0.296
0.57%
1 jan 1994 ano
52.688
+0.254
0.48%
1 jan 1995 ano
52.924
+0.236
0.45%
1 jan 1996 ano
53.148
+0.225
0.42%
1 jan 1997 ano
53.382
+0.233
0.44%
1 jan 1998 ano
53.61
+0.228
0.43%
1 jan 1999 ano
54.187
+0.577
1.08%
1 jan 2000 ano
54.758
+0.572
1.05%
1 jan 2001 ano
55.323
+0.565
1.03%
1 jan 2002 ano
55.885
+0.562
1.02%
1 jan 2003 ano
56.439
+0.554
0.99%
1 jan 2004 ano
57.446
+1.006
1.78%
1 jan 2005 ano
58.45
+1.004
1.75%
1 jan 2006 ano
59.453
+1.003
1.72%
1 jan 2007 ano
60.467
+1.014
1.71%
1 jan 2008 ano
61.48
+1.013
1.68%
1 jan 2009 ano
62.361
+0.881
1.43%
1 jan 2010 ano
63.234
+0.874
1.4%
1 jan 2011 ano
64.101
+0.867
1.37%
1 jan 2012 ano
64.957
+0.856
1.34%
1 jan 2013 ano
65.81
+0.853
1.31%
1 jan 2014 ano
66.394
+0.584
0.89%
1 jan 2015 ano
66.982
+0.588
0.89%
Classificação de países por estatísticas atuais por anos


Comentários: