29
/pt/
pt
AIzaSyAYiBZKx7MnpbEhh9jyipgxe19OcubqV5w
April 1, 2024
62230
Upper middle income
UMC
false
2
1
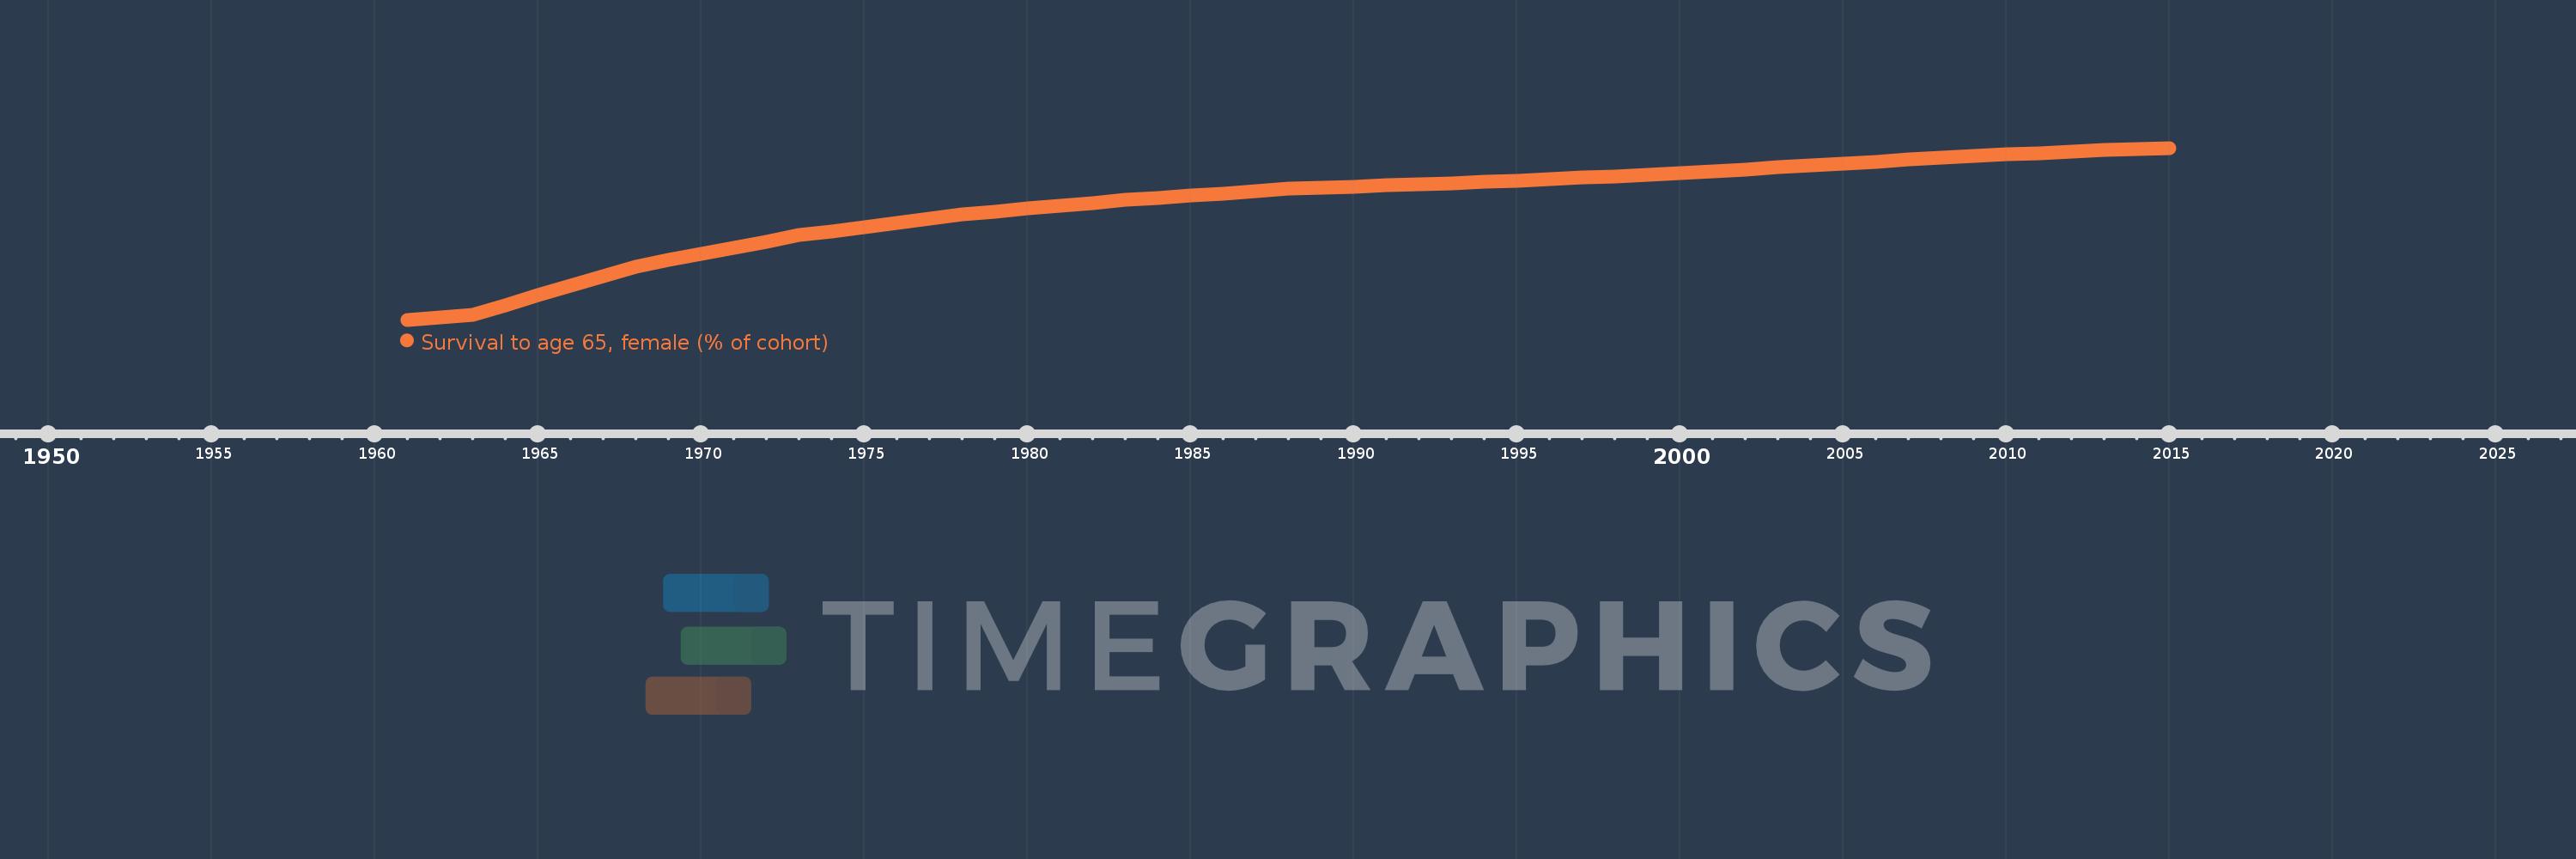
Survival to age 65, female (% of cohort)
2015,2014,2013,2012,2011,2010,2009,2008,2007,2006,2005,2004,2003,2002,2001,2000,1999,1998,1997,1996,1995,1994,1993,1992,1991,1990,1989,1988,1987,1986,1985,1984,1983,1982,1981,1980,1979,1978,1977,1976,1975,1974,1973,1972,1971,1970,1969,1968,1967,1966,1965,1964,1963,1962,1961
Estas estatísticas em outros países:
AfghanistanAlbaniaAlgeriaAngolaAntigua and BarbudaArab WorldArgentinaArmeniaArubaAustraliaAustriaAzerbaijanBahamas, TheBahrainBangladeshBarbadosBelarusBelgiumBelizeBeninBhutanBoliviaBosnia and HerzegovinaBotswanaBrazilBrunei DarussalamBulgariaBurkina FasoBurundiCabo VerdeCambodiaCameroonCanadaCaribbean small statesCentral African RepublicCentral Europe and the BalticsChadChannel IslandsChileChinaColombiaComorosCongo, Dem. Rep.Congo, Rep.Costa RicaCote d'IvoireCroatiaCubaCuracaoCyprusCzech RepublicDenmarkDjiboutiDominican RepublicEarly-demographic dividendEast Asia & PacificEast Asia & Pacific (excluding high income)East Asia & Pacific (IDA & IBRD countries)EcuadorEgypt, Arab Rep.El SalvadorEquatorial GuineaEritreaEstoniaEthiopiaEuro areaEurope & Central AsiaEurope & Central Asia (excluding high income)Europe & Central Asia (IDA & IBRD countries)European UnionFijiFinlandFragile and conflict affected situationsFranceFrench PolynesiaGabonGambia, TheGeorgiaGermanyGhanaGreeceGrenadaGuamGuatemalaGuineaGuinea-BissauGuyanaHaitiHeavily indebted poor countries (HIPC)High incomeHondurasHong Kong SAR, ChinaHungaryIBRD onlyIcelandIDA & IBRD totalIDA blendIDA onlyIDA totalIndiaIndonesiaIran, Islamic Rep.IraqIrelandIsraelItalyJamaicaJapanJordanKazakhstanKenyaKiribatiKorea, Dem. People’s Rep.Korea, Rep.KuwaitKyrgyz RepublicLao PDRLate-demographic dividendLatin America & Caribbean Latin America & Caribbean (excluding high income)Latin America & the Caribbean (IDA & IBRD countries)LatviaLeast developed countries: UN classificationLebanonLesothoLiberiaLibyaLithuaniaLow & middle incomeLow incomeLower middle incomeLuxembourgMacao SAR, ChinaMacedonia, FYRMadagascarMalawiMalaysiaMaldivesMaliMaltaMauritaniaMauritiusMexicoMicronesia, Fed. Sts.Middle East & North AfricaMiddle East & North Africa (excluding high income)Middle East & North Africa (IDA & IBRD countries)Middle incomeMoldovaMongoliaMontenegroMoroccoMozambiqueMyanmarNamibiaNepalNetherlandsNew CaledoniaNew ZealandNicaraguaNigerNigeriaNorth AmericaNorwayOECD membersOmanOther small statesPacific island small statesPakistanPanamaPapua New GuineaParaguayPeruPhilippinesPolandPortugalPost-demographic dividendPre-demographic dividendPuerto RicoQatarRomaniaRussian FederationRwandaSamoaSao Tome and PrincipeSaudi ArabiaSenegalSerbiaSeychellesSierra LeoneSingaporeSlovak RepublicSloveniaSmall statesSolomon IslandsSomaliaSouth AfricaSouth AsiaSouth Asia (IDA & IBRD)South SudanSpainSri LankaSt. LuciaSt. Vincent and the GrenadinesSub-Saharan Africa Sub-Saharan Africa (excluding high income)Sub-Saharan Africa (IDA & IBRD countries)SudanSurinameSwazilandSwedenSwitzerlandSyrian Arab RepublicTajikistanTanzaniaThailandTimor-LesteTogoTongaTrinidad and TobagoTunisiaTurkeyTurkmenistanUgandaUkraineUnited Arab EmiratesUnited KingdomUnited StatesUpper middle incomeUruguayUzbekistanVanuatuVenezuela, RBVietnamVirgin Islands (U.S.)West Bank and GazaWorldYemen, Rep.ZambiaZimbabwe Linha do tempo:
Nesta escala de tempo está apresentado um gráfico de 1961 ano até 2015 ano Upper middle income. Dados de 1960 ano ausente. O número de observações reais por data: 55.
Fonte (nome):
Indicadores de desenvolvimento mundial
Fonte (organização):
United Nations Population Division. World Population Prospects. New York, United Nations, Department of Economic and Social Affairs (advanced Excel tables). Available at http://esa.un.org/wpp/unpp/panel_population.htm.
Categorias:
Health, Gender
Foi atualizado:
23 abr 2017 ano
Indicadores de alterações dos valores ao longo dos anos
Mínimo:
47.094
1 jan 1961 ano
Máximo:
84.872
1 jan 2015 ano
Na data de observação
Valor
Mudança absoluta
A alteração em relação ao valor anterior
1 jan 1961 ano
47.094
+47.094
0.0%
1 jan 1962 ano
47.667
+0.573
1.22%
1 jan 1963 ano
48.171
+0.504
1.06%
1 jan 1964 ano
50.318
+2.147
4.46%
1 jan 1965 ano
52.461
+2.142
4.26%
1 jan 1966 ano
54.579
+2.118
4.04%
1 jan 1967 ano
56.706
+2.127
3.9%
1 jan 1968 ano
58.831
+2.125
3.75%
1 jan 1969 ano
60.17
+1.339
2.28%
1 jan 1970 ano
61.518
+1.348
2.24%
1 jan 1971 ano
62.878
+1.361
2.21%
1 jan 1972 ano
64.264
+1.385
2.2%
1 jan 1973 ano
65.656
+1.392
2.17%
1 jan 1974 ano
66.574
+0.918
1.4%
1 jan 1975 ano
67.495
+0.921
1.38%
1 jan 1976 ano
68.419
+0.923
1.37%
1 jan 1977 ano
69.346
+0.927
1.36%
1 jan 1978 ano
70.278
+0.932
1.34%
1 jan 1979 ano
70.893
+0.615
0.88%
1 jan 1980 ano
71.512
+0.619
0.87%
1 jan 1981 ano
72.136
+0.623
0.87%
1 jan 1982 ano
72.767
+0.631
0.88%
1 jan 1983 ano
73.402
+0.635
0.87%
1 jan 1984 ano
73.897
+0.495
0.67%
1 jan 1985 ano
74.393
+0.496
0.67%
1 jan 1986 ano
74.89
+0.497
0.67%
1 jan 1987 ano
75.391
+0.501
0.67%
1 jan 1988 ano
75.893
+0.502
0.67%
1 jan 1989 ano
76.126
+0.234
0.31%
1 jan 1990 ano
76.364
+0.237
0.31%
1 jan 1991 ano
76.604
+0.241
0.32%
1 jan 1992 ano
76.847
+0.242
0.32%
1 jan 1993 ano
77.094
+0.248
0.32%
1 jan 1994 ano
77.396
+0.302
0.39%
1 jan 1995 ano
77.698
+0.302
0.39%
1 jan 1996 ano
78.0
+0.302
0.39%
1 jan 1997 ano
78.308
+0.307
0.39%
1 jan 1998 ano
78.614
+0.306
0.39%
1 jan 1999 ano
79.001
+0.387
0.49%
1 jan 2000 ano
79.387
+0.386
0.49%
1 jan 2001 ano
79.773
+0.386
0.49%
1 jan 2002 ano
80.167
+0.394
0.49%
1 jan 2003 ano
80.57
+0.403
0.5%
1 jan 2004 ano
81.01
+0.441
0.55%
1 jan 2005 ano
81.449
+0.439
0.54%
1 jan 2006 ano
81.885
+0.436
0.53%
1 jan 2007 ano
82.318
+0.433
0.53%
1 jan 2008 ano
82.748
+0.43
0.52%
1 jan 2009 ano
83.091
+0.343
0.41%
1 jan 2010 ano
83.431
+0.34
0.41%
1 jan 2011 ano
83.77
+0.339
0.41%
1 jan 2012 ano
84.109
+0.339
0.4%
1 jan 2013 ano
84.445
+0.336
0.4%
1 jan 2014 ano
84.659
+0.214
0.25%
1 jan 2015 ano
84.872
+0.213
0.25%
Classificação de países por estatísticas atuais por anos


Comentários: