29
/pt/
pt
AIzaSyAYiBZKx7MnpbEhh9jyipgxe19OcubqV5w
April 1, 2024
264028
Timor-Leste
TLS
true
2
1
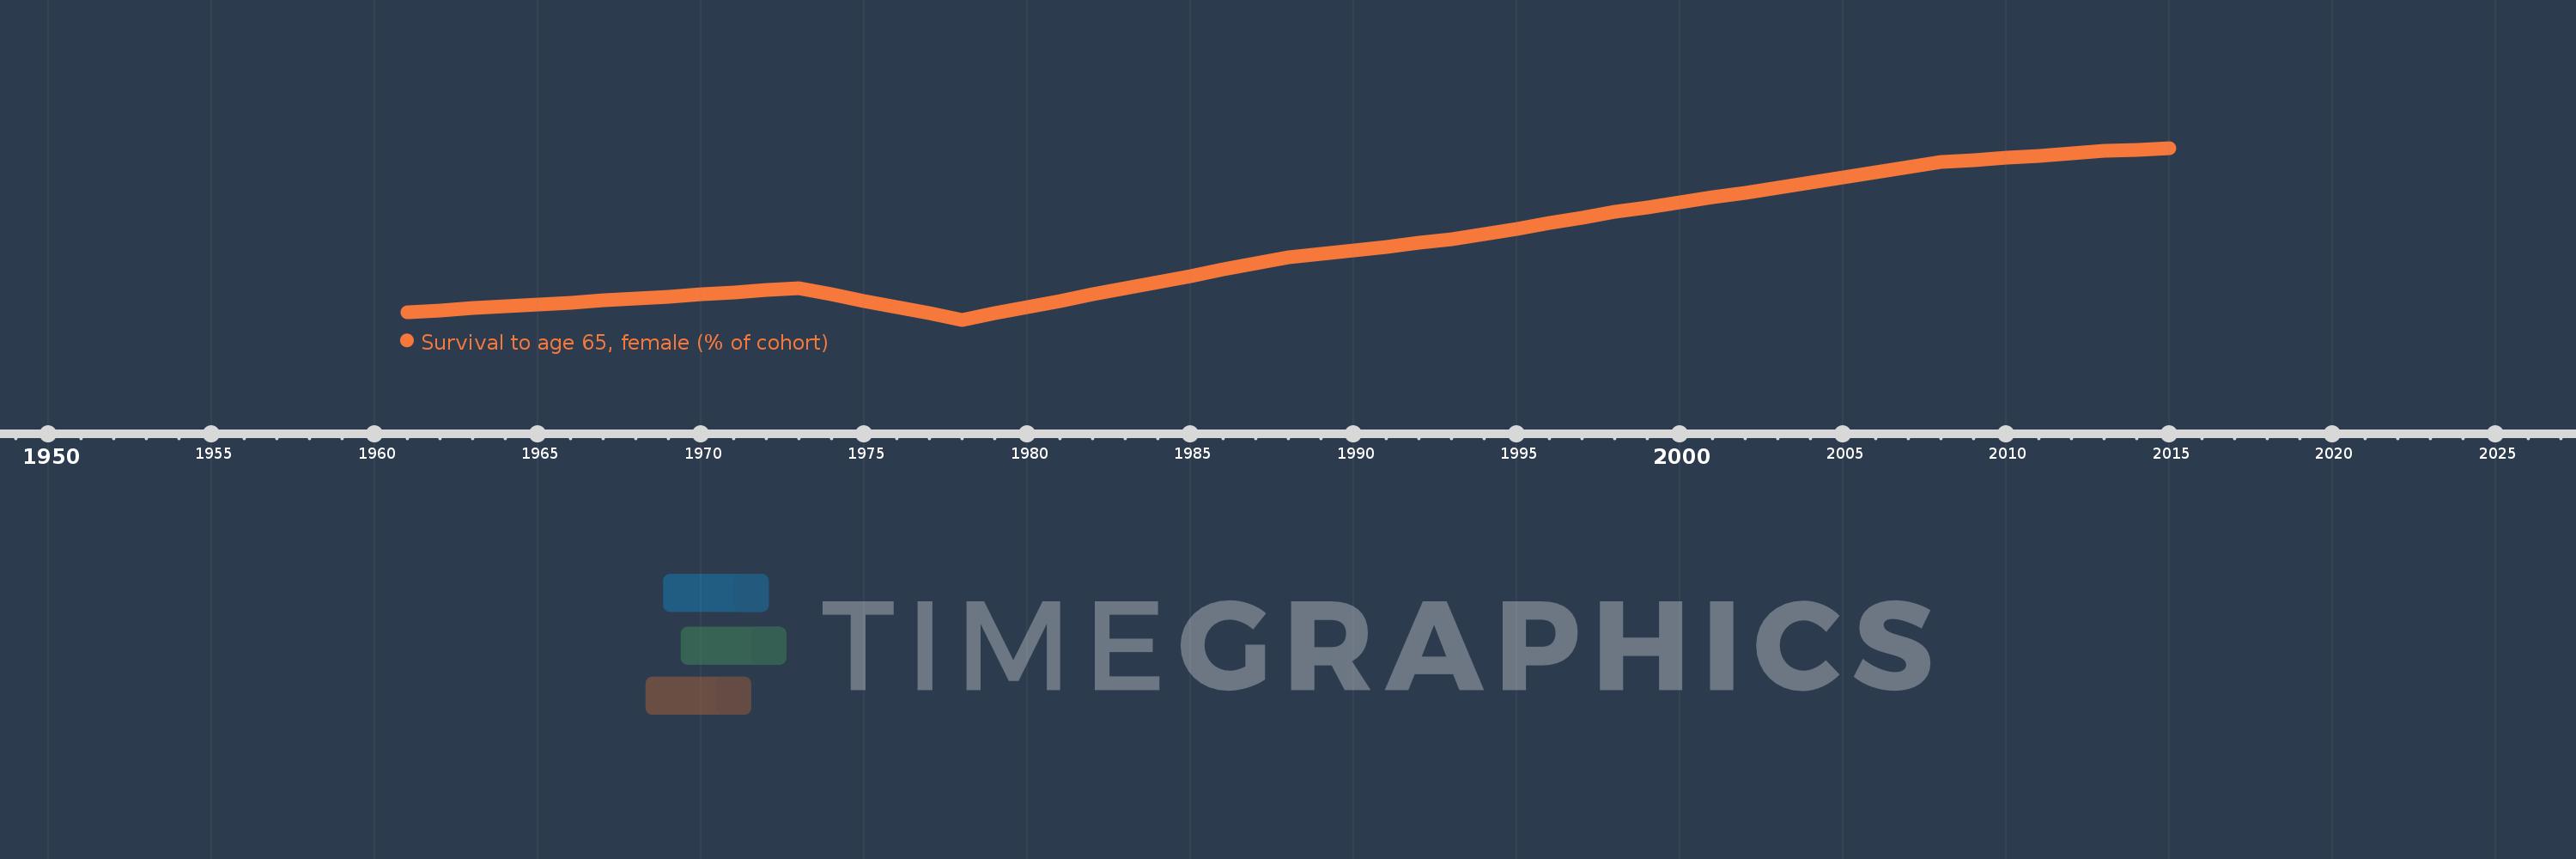
Survival to age 65, female (% of cohort)
2015,2014,2013,2012,2011,2010,2009,2008,2007,2006,2005,2004,2003,2002,2001,2000,1999,1998,1997,1996,1995,1994,1993,1992,1991,1990,1989,1988,1987,1986,1985,1984,1983,1982,1981,1980,1979,1978,1977,1976,1975,1974,1973,1972,1971,1970,1969,1968,1967,1966,1965,1964,1963,1962,1961
Estas estatísticas em outros países:
AfghanistanAlbaniaAlgeriaAngolaAntigua and BarbudaArab WorldArgentinaArmeniaArubaAustraliaAustriaAzerbaijanBahamas, TheBahrainBangladeshBarbadosBelarusBelgiumBelizeBeninBhutanBoliviaBosnia and HerzegovinaBotswanaBrazilBrunei DarussalamBulgariaBurkina FasoBurundiCabo VerdeCambodiaCameroonCanadaCaribbean small statesCentral African RepublicCentral Europe and the BalticsChadChannel IslandsChileChinaColombiaComorosCongo, Dem. Rep.Congo, Rep.Costa RicaCote d'IvoireCroatiaCubaCuracaoCyprusCzech RepublicDenmarkDjiboutiDominican RepublicEarly-demographic dividendEast Asia & PacificEast Asia & Pacific (excluding high income)East Asia & Pacific (IDA & IBRD countries)EcuadorEgypt, Arab Rep.El SalvadorEquatorial GuineaEritreaEstoniaEthiopiaEuro areaEurope & Central AsiaEurope & Central Asia (excluding high income)Europe & Central Asia (IDA & IBRD countries)European UnionFijiFinlandFragile and conflict affected situationsFranceFrench PolynesiaGabonGambia, TheGeorgiaGermanyGhanaGreeceGrenadaGuamGuatemalaGuineaGuinea-BissauGuyanaHaitiHeavily indebted poor countries (HIPC)High incomeHondurasHong Kong SAR, ChinaHungaryIBRD onlyIcelandIDA & IBRD totalIDA blendIDA onlyIDA totalIndiaIndonesiaIran, Islamic Rep.IraqIrelandIsraelItalyJamaicaJapanJordanKazakhstanKenyaKiribatiKorea, Dem. People’s Rep.Korea, Rep.KuwaitKyrgyz RepublicLao PDRLate-demographic dividendLatin America & Caribbean Latin America & Caribbean (excluding high income)Latin America & the Caribbean (IDA & IBRD countries)LatviaLeast developed countries: UN classificationLebanonLesothoLiberiaLibyaLithuaniaLow & middle incomeLow incomeLower middle incomeLuxembourgMacao SAR, ChinaMacedonia, FYRMadagascarMalawiMalaysiaMaldivesMaliMaltaMauritaniaMauritiusMexicoMicronesia, Fed. Sts.Middle East & North AfricaMiddle East & North Africa (excluding high income)Middle East & North Africa (IDA & IBRD countries)Middle incomeMoldovaMongoliaMontenegroMoroccoMozambiqueMyanmarNamibiaNepalNetherlandsNew CaledoniaNew ZealandNicaraguaNigerNigeriaNorth AmericaNorwayOECD membersOmanOther small statesPacific island small statesPakistanPanamaPapua New GuineaParaguayPeruPhilippinesPolandPortugalPost-demographic dividendPre-demographic dividendPuerto RicoQatarRomaniaRussian FederationRwandaSamoaSao Tome and PrincipeSaudi ArabiaSenegalSerbiaSeychellesSierra LeoneSingaporeSlovak RepublicSloveniaSmall statesSolomon IslandsSomaliaSouth AfricaSouth AsiaSouth Asia (IDA & IBRD)South SudanSpainSri LankaSt. LuciaSt. Vincent and the GrenadinesSub-Saharan Africa Sub-Saharan Africa (excluding high income)Sub-Saharan Africa (IDA & IBRD countries)SudanSurinameSwazilandSwedenSwitzerlandSyrian Arab RepublicTajikistanTanzaniaThailandTimor-LesteTogoTongaTrinidad and TobagoTunisiaTurkeyTurkmenistanUgandaUkraineUnited Arab EmiratesUnited KingdomUnited StatesUpper middle incomeUruguayUzbekistanVanuatuVenezuela, RBVietnamVirgin Islands (U.S.)West Bank and GazaWorldYemen, Rep.ZambiaZimbabwe Linha do tempo:
Nesta escala de tempo está apresentado um gráfico de 1961 ano até 2015 ano Timor-Leste. Dados de 1960 ano ausente. O número de observações reais por data: 55.
Fonte (nome):
Indicadores de desenvolvimento mundial
Fonte (organização):
United Nations Population Division. World Population Prospects. New York, United Nations, Department of Economic and Social Affairs (advanced Excel tables). Available at http://esa.un.org/wpp/unpp/panel_population.htm.
Categorias:
Health, Gender
Foi atualizado:
23 abr 2017 ano
Indicadores de alterações dos valores ao longo dos anos
Mínimo:
20.155
1 jan 1978 ano
Máximo:
75.958
1 jan 2015 ano
Na data de observação
Valor
Mudança absoluta
A alteração em relação ao valor anterior
1 jan 1961 ano
22.643
+22.643
0.0%
1 jan 1962 ano
23.248
+0.604
2.67%
1 jan 1963 ano
23.852
+0.604
2.6%
1 jan 1964 ano
24.491
+0.639
2.68%
1 jan 1965 ano
25.129
+0.639
2.61%
1 jan 1966 ano
25.768
+0.639
2.54%
1 jan 1967 ano
26.407
+0.639
2.48%
1 jan 1968 ano
27.045
+0.639
2.42%
1 jan 1969 ano
27.722
+0.677
2.5%
1 jan 1970 ano
28.399
+0.677
2.44%
1 jan 1971 ano
29.075
+0.677
2.38%
1 jan 1972 ano
29.752
+0.677
2.33%
1 jan 1973 ano
30.428
+0.677
2.27%
1 jan 1974 ano
28.374
-2.055
-6.75%
1 jan 1975 ano
26.319
-2.055
-7.24%
1 jan 1976 ano
24.265
-2.055
-7.81%
1 jan 1977 ano
22.21
-2.055
-8.47%
1 jan 1978 ano
20.155
-2.055
-9.25%
1 jan 1979 ano
22.199
+2.044
10.14%
1 jan 1980 ano
24.243
+2.044
9.21%
1 jan 1981 ano
26.287
+2.044
8.43%
1 jan 1982 ano
28.332
+2.044
7.78%
1 jan 1983 ano
30.376
+2.044
7.21%
1 jan 1984 ano
32.401
+2.025
6.67%
1 jan 1985 ano
34.426
+2.025
6.25%
1 jan 1986 ano
36.451
+2.025
5.88%
1 jan 1987 ano
38.476
+2.025
5.56%
1 jan 1988 ano
40.501
+2.025
5.26%
1 jan 1989 ano
41.639
+1.138
2.81%
1 jan 1990 ano
42.776
+1.138
2.73%
1 jan 1991 ano
43.914
+1.138
2.66%
1 jan 1992 ano
45.052
+1.138
2.59%
1 jan 1993 ano
46.189
+1.138
2.53%
1 jan 1994 ano
47.977
+1.787
3.87%
1 jan 1995 ano
49.764
+1.787
3.73%
1 jan 1996 ano
51.551
+1.787
3.59%
1 jan 1997 ano
53.339
+1.787
3.47%
1 jan 1998 ano
55.126
+1.787
3.35%
1 jan 1999 ano
56.703
+1.578
2.86%
1 jan 2000 ano
58.281
+1.577
2.78%
1 jan 2001 ano
59.858
+1.578
2.71%
1 jan 2002 ano
61.436
+1.577
2.64%
1 jan 2003 ano
63.013
+1.578
2.57%
1 jan 2004 ano
64.674
+1.66
2.64%
1 jan 2005 ano
66.334
+1.66
2.57%
1 jan 2006 ano
67.995
+1.66
2.5%
1 jan 2007 ano
69.655
+1.66
2.44%
1 jan 2008 ano
71.316
+1.66
2.38%
1 jan 2009 ano
72.032
+0.716
1.0%
1 jan 2010 ano
72.748
+0.716
0.99%
1 jan 2011 ano
73.465
+0.716
0.98%
1 jan 2012 ano
74.181
+0.716
0.98%
1 jan 2013 ano
74.898
+0.716
0.97%
1 jan 2014 ano
75.428
+0.53
0.71%
1 jan 2015 ano
75.958
+0.53
0.7%
Classificação de países por estatísticas atuais por anos


Comentários: