29
/pt/
pt
AIzaSyAYiBZKx7MnpbEhh9jyipgxe19OcubqV5w
April 1, 2024
119428
Denmark
DNK
true
2
1
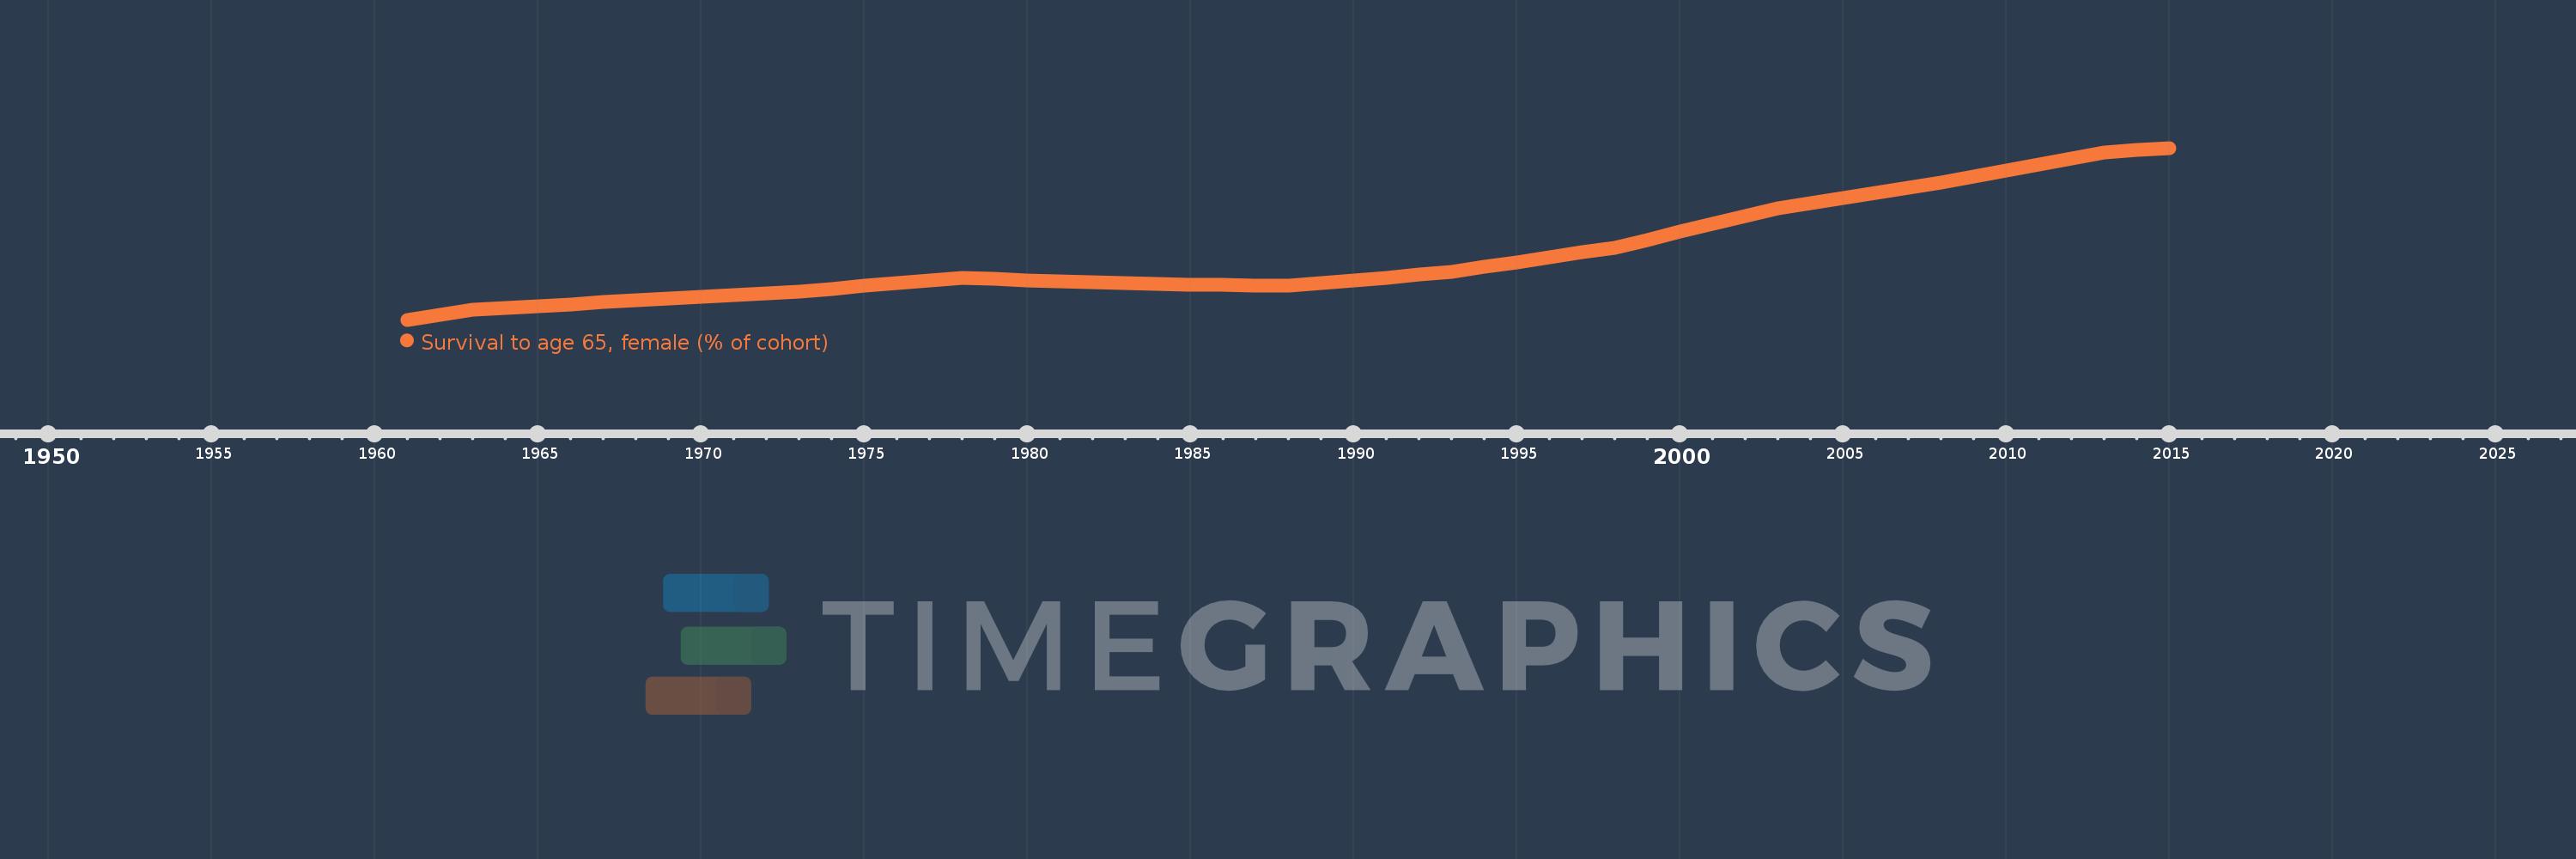
Survival to age 65, female (% of cohort)
2015,2014,2013,2012,2011,2010,2009,2008,2007,2006,2005,2004,2003,2002,2001,2000,1999,1998,1997,1996,1995,1994,1993,1992,1991,1990,1989,1988,1987,1986,1985,1984,1983,1982,1981,1980,1979,1978,1977,1976,1975,1974,1973,1972,1971,1970,1969,1968,1967,1966,1965,1964,1963,1962,1961
Estas estatísticas em outros países:
AfghanistanAlbaniaAlgeriaAngolaAntigua and BarbudaArab WorldArgentinaArmeniaArubaAustraliaAustriaAzerbaijanBahamas, TheBahrainBangladeshBarbadosBelarusBelgiumBelizeBeninBhutanBoliviaBosnia and HerzegovinaBotswanaBrazilBrunei DarussalamBulgariaBurkina FasoBurundiCabo VerdeCambodiaCameroonCanadaCaribbean small statesCentral African RepublicCentral Europe and the BalticsChadChannel IslandsChileChinaColombiaComorosCongo, Dem. Rep.Congo, Rep.Costa RicaCote d'IvoireCroatiaCubaCuracaoCyprusCzech RepublicDenmarkDjiboutiDominican RepublicEarly-demographic dividendEast Asia & PacificEast Asia & Pacific (excluding high income)East Asia & Pacific (IDA & IBRD countries)EcuadorEgypt, Arab Rep.El SalvadorEquatorial GuineaEritreaEstoniaEthiopiaEuro areaEurope & Central AsiaEurope & Central Asia (excluding high income)Europe & Central Asia (IDA & IBRD countries)European UnionFijiFinlandFragile and conflict affected situationsFranceFrench PolynesiaGabonGambia, TheGeorgiaGermanyGhanaGreeceGrenadaGuamGuatemalaGuineaGuinea-BissauGuyanaHaitiHeavily indebted poor countries (HIPC)High incomeHondurasHong Kong SAR, ChinaHungaryIBRD onlyIcelandIDA & IBRD totalIDA blendIDA onlyIDA totalIndiaIndonesiaIran, Islamic Rep.IraqIrelandIsraelItalyJamaicaJapanJordanKazakhstanKenyaKiribatiKorea, Dem. People’s Rep.Korea, Rep.KuwaitKyrgyz RepublicLao PDRLate-demographic dividendLatin America & Caribbean Latin America & Caribbean (excluding high income)Latin America & the Caribbean (IDA & IBRD countries)LatviaLeast developed countries: UN classificationLebanonLesothoLiberiaLibyaLithuaniaLow & middle incomeLow incomeLower middle incomeLuxembourgMacao SAR, ChinaMacedonia, FYRMadagascarMalawiMalaysiaMaldivesMaliMaltaMauritaniaMauritiusMexicoMicronesia, Fed. Sts.Middle East & North AfricaMiddle East & North Africa (excluding high income)Middle East & North Africa (IDA & IBRD countries)Middle incomeMoldovaMongoliaMontenegroMoroccoMozambiqueMyanmarNamibiaNepalNetherlandsNew CaledoniaNew ZealandNicaraguaNigerNigeriaNorth AmericaNorwayOECD membersOmanOther small statesPacific island small statesPakistanPanamaPapua New GuineaParaguayPeruPhilippinesPolandPortugalPost-demographic dividendPre-demographic dividendPuerto RicoQatarRomaniaRussian FederationRwandaSamoaSao Tome and PrincipeSaudi ArabiaSenegalSerbiaSeychellesSierra LeoneSingaporeSlovak RepublicSloveniaSmall statesSolomon IslandsSomaliaSouth AfricaSouth AsiaSouth Asia (IDA & IBRD)South SudanSpainSri LankaSt. LuciaSt. Vincent and the GrenadinesSub-Saharan Africa Sub-Saharan Africa (excluding high income)Sub-Saharan Africa (IDA & IBRD countries)SudanSurinameSwazilandSwedenSwitzerlandSyrian Arab RepublicTajikistanTanzaniaThailandTimor-LesteTogoTongaTrinidad and TobagoTunisiaTurkeyTurkmenistanUgandaUkraineUnited Arab EmiratesUnited KingdomUnited StatesUpper middle incomeUruguayUzbekistanVanuatuVenezuela, RBVietnamVirgin Islands (U.S.)West Bank and GazaWorldYemen, Rep.ZambiaZimbabwe Linha do tempo:
Nesta escala de tempo está apresentado um gráfico de 1961 ano até 2015 ano Denmark. Dados de 1960 ano ausente. O número de observações reais por data: 55.
Fonte (nome):
Indicadores de desenvolvimento mundial
Fonte (organização):
United Nations Population Division. World Population Prospects. New York, United Nations, Department of Economic and Social Affairs (advanced Excel tables). Available at http://esa.un.org/wpp/unpp/panel_population.htm.
Categorias:
Health, Gender
Foi atualizado:
23 abr 2017 ano
Indicadores de alterações dos valores ao longo dos anos
Mínimo:
81.938
1 jan 1961 ano
Máximo:
90.669
1 jan 2015 ano
Na data de observação
Valor
Mudança absoluta
A alteração em relação ao valor anterior
1 jan 1961 ano
81.938
+81.938
0.0%
1 jan 1962 ano
82.189
+0.251
0.31%
1 jan 1963 ano
82.44
+0.251
0.31%
1 jan 1964 ano
82.536
+0.096
0.12%
1 jan 1965 ano
82.632
+0.096
0.12%
1 jan 1966 ano
82.729
+0.096
0.12%
1 jan 1967 ano
82.825
+0.096
0.12%
1 jan 1968 ano
82.921
+0.096
0.12%
1 jan 1969 ano
83.013
+0.092
0.11%
1 jan 1970 ano
83.105
+0.092
0.11%
1 jan 1971 ano
83.197
+0.092
0.11%
1 jan 1972 ano
83.289
+0.092
0.11%
1 jan 1973 ano
83.381
+0.092
0.11%
1 jan 1974 ano
83.517
+0.136
0.16%
1 jan 1975 ano
83.652
+0.136
0.16%
1 jan 1976 ano
83.788
+0.136
0.16%
1 jan 1977 ano
83.923
+0.136
0.16%
1 jan 1978 ano
84.059
+0.136
0.16%
1 jan 1979 ano
84.004
-0.055
-0.07%
1 jan 1980 ano
83.949
-0.055
-0.07%
1 jan 1981 ano
83.894
-0.055
-0.07%
1 jan 1982 ano
83.839
-0.055
-0.07%
1 jan 1983 ano
83.784
-0.055
-0.07%
1 jan 1984 ano
83.758
-0.026
-0.03%
1 jan 1985 ano
83.732
-0.026
-0.03%
1 jan 1986 ano
83.705
-0.026
-0.03%
1 jan 1987 ano
83.679
-0.026
-0.03%
1 jan 1988 ano
83.653
-0.026
-0.03%
1 jan 1989 ano
83.795
+0.142
0.17%
1 jan 1990 ano
83.937
+0.142
0.17%
1 jan 1991 ano
84.08
+0.142
0.17%
1 jan 1992 ano
84.222
+0.142
0.17%
1 jan 1993 ano
84.364
+0.142
0.17%
1 jan 1994 ano
84.612
+0.248
0.29%
1 jan 1995 ano
84.86
+0.248
0.29%
1 jan 1996 ano
85.108
+0.248
0.29%
1 jan 1997 ano
85.356
+0.248
0.29%
1 jan 1998 ano
85.605
+0.248
0.29%
1 jan 1999 ano
86.004
+0.399
0.47%
1 jan 2000 ano
86.403
+0.399
0.46%
1 jan 2001 ano
86.802
+0.399
0.46%
1 jan 2002 ano
87.201
+0.399
0.46%
1 jan 2003 ano
87.601
+0.399
0.46%
1 jan 2004 ano
87.866
+0.266
0.3%
1 jan 2005 ano
88.132
+0.266
0.3%
1 jan 2006 ano
88.398
+0.266
0.3%
1 jan 2007 ano
88.664
+0.266
0.3%
1 jan 2008 ano
88.929
+0.266
0.3%
1 jan 2009 ano
89.23
+0.301
0.34%
1 jan 2010 ano
89.531
+0.301
0.34%
1 jan 2011 ano
89.832
+0.301
0.34%
1 jan 2012 ano
90.132
+0.301
0.33%
1 jan 2013 ano
90.433
+0.301
0.33%
1 jan 2014 ano
90.551
+0.118
0.13%
1 jan 2015 ano
90.669
+0.118
0.13%
Classificação de países por estatísticas atuais por anos


Comentários: