29
/pt/
pt
AIzaSyAYiBZKx7MnpbEhh9jyipgxe19OcubqV5w
April 1, 2024
95569
Burkina Faso
BFA
true
2
1
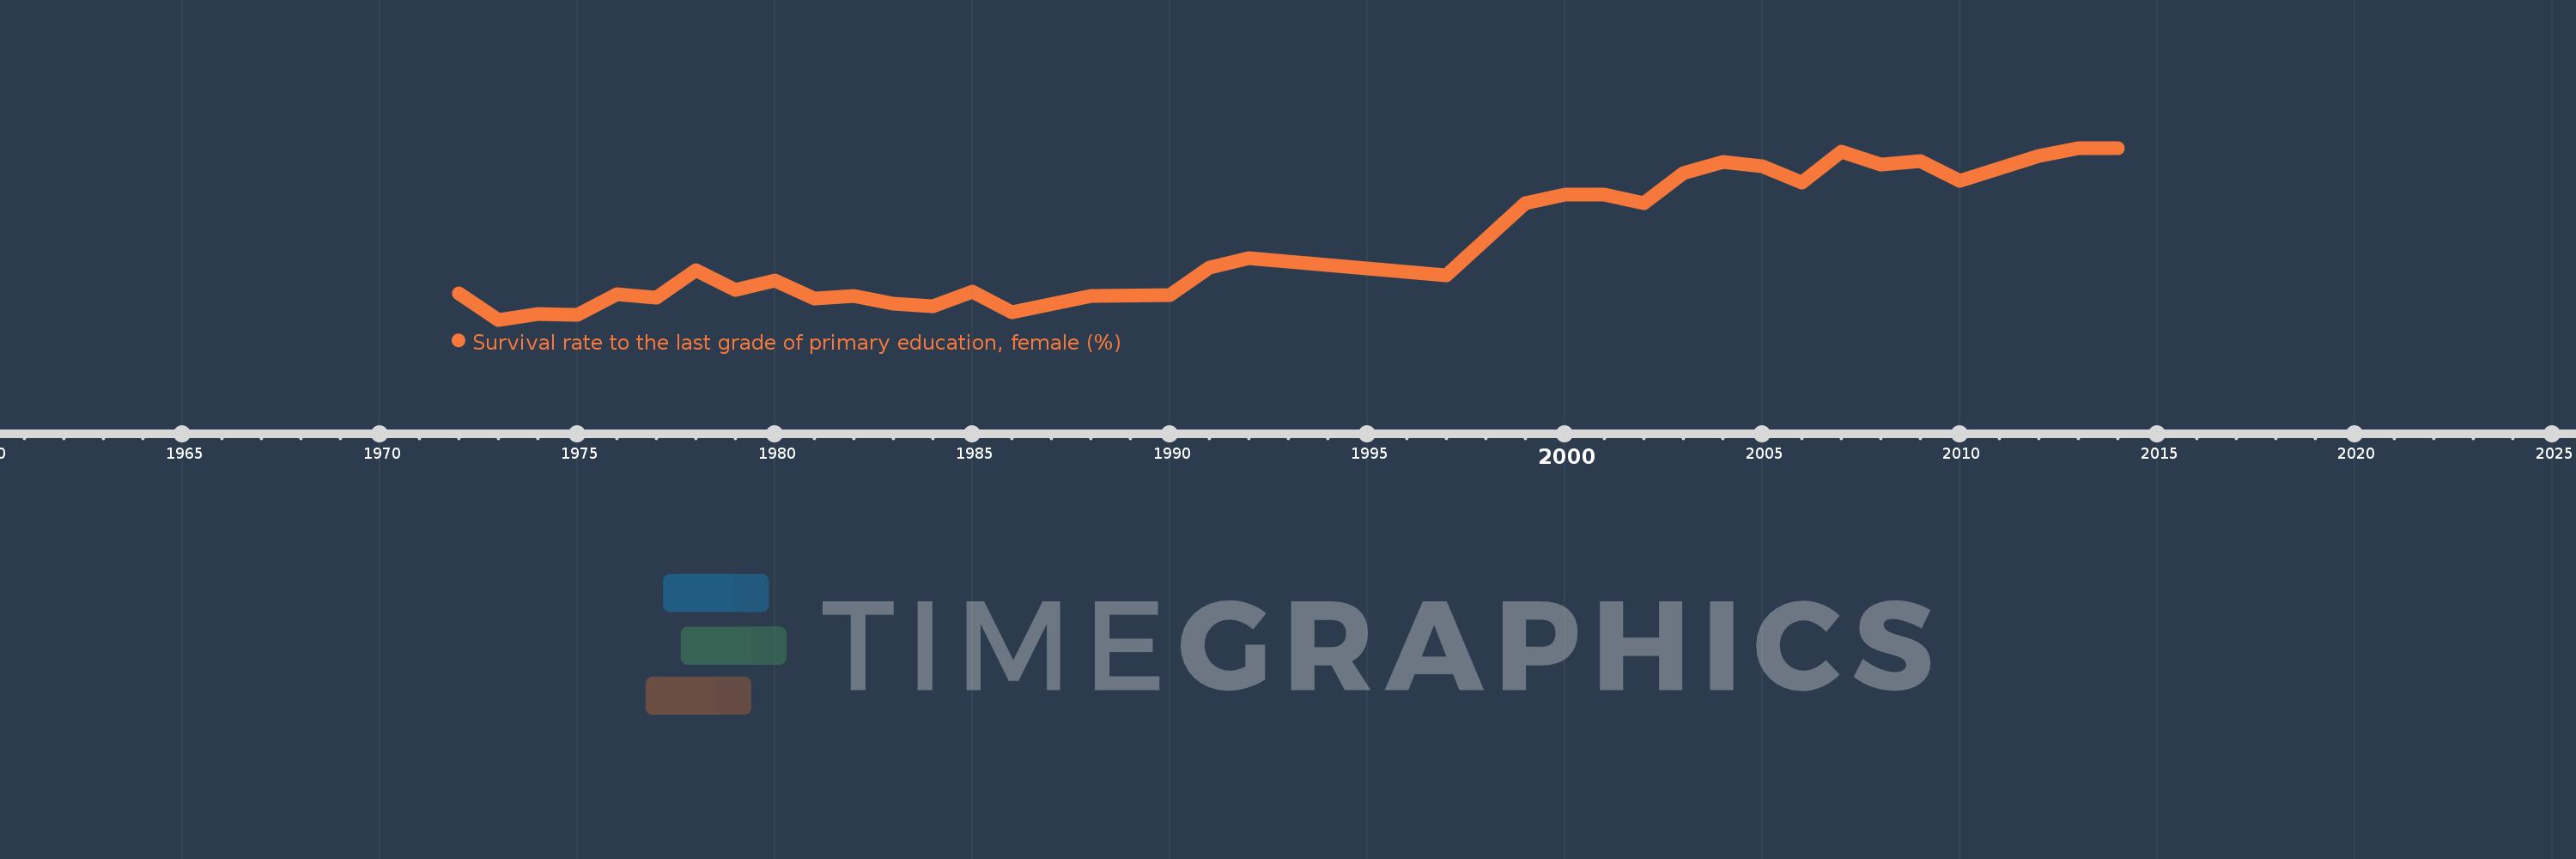
Survival rate to the last grade of primary education, female (%)
2014,2013,2012,2010,2009,2008,2007,2006,2005,2004,2003,2002,2001,2000,1999,1997,1992,1991,1990,1988,1986,1985,1984,1983,1982,1981,1980,1979,1978,1977,1976,1975,1974,1973,1972
Estas estatísticas em outros países:
AfghanistanAlbaniaAlgeriaAndorraAngolaArab WorldArgentinaArmeniaArubaAustriaAzerbaijanBahamas, TheBahrainBangladeshBarbadosBelarusBelgiumBelizeBeninBermudaBhutanBoliviaBosnia and HerzegovinaBotswanaBrazilBrunei DarussalamBulgariaBurkina FasoBurundiCabo VerdeCambodiaCameroonCanadaCaribbean small statesCentral African RepublicCentral Europe and the BalticsChadChileChinaColombiaComorosCongo, Dem. Rep.Congo, Rep.Costa RicaCote d'IvoireCroatiaCubaCyprusCzech RepublicDenmarkDjiboutiDominicaDominican RepublicEarly-demographic dividendEast Asia & PacificEast Asia & Pacific (excluding high income)East Asia & Pacific (IDA & IBRD countries)EcuadorEgypt, Arab Rep.El SalvadorEquatorial GuineaEritreaEstoniaEthiopiaEuro areaEurope & Central AsiaEurope & Central Asia (excluding high income)Europe & Central Asia (IDA & IBRD countries)European UnionFijiFinlandFragile and conflict affected situationsFranceGabonGambia, TheGeorgiaGermanyGhanaGreeceGuatemalaGuineaGuinea-BissauGuyanaHaitiHeavily indebted poor countries (HIPC)High incomeHondurasHong Kong SAR, ChinaHungaryIBRD onlyIcelandIDA & IBRD totalIDA blendIDA onlyIDA totalIndiaIndonesiaIran, Islamic Rep.IraqIsraelItalyJamaicaJapanJordanKazakhstanKenyaKiribatiKorea, Rep.KuwaitKyrgyz RepublicLao PDRLate-demographic dividendLatin America & Caribbean Latin America & Caribbean (excluding high income)Latin America & the Caribbean (IDA & IBRD countries)LatviaLeast developed countries: UN classificationLebanonLesothoLiberiaLibyaLiechtensteinLithuaniaLow & middle incomeLow incomeLower middle incomeLuxembourgMacao SAR, ChinaMacedonia, FYRMadagascarMalawiMalaysiaMaldivesMaliMaltaMarshall IslandsMauritaniaMauritiusMexicoMiddle East & North AfricaMiddle East & North Africa (excluding high income)Middle East & North Africa (IDA & IBRD countries)Middle incomeMoldovaMongoliaMontenegroMoroccoMozambiqueMyanmarNamibiaNepalNetherlandsNicaraguaNigerNigeriaNorth AmericaNorwayOECD membersOmanOther small statesPacific island small statesPakistanPanamaPapua New GuineaParaguayPeruPhilippinesPolandPortugalPost-demographic dividendPre-demographic dividendQatarRomaniaRussian FederationRwandaSamoaSan MarinoSao Tome and PrincipeSaudi ArabiaSenegalSerbiaSeychellesSierra LeoneSingaporeSlovak RepublicSloveniaSmall statesSolomon IslandsSouth AfricaSouth AsiaSouth Asia (IDA & IBRD)SpainSri LankaSt. Kitts and NevisSt. LuciaSt. Vincent and the GrenadinesSub-Saharan Africa Sub-Saharan Africa (excluding high income)Sub-Saharan Africa (IDA & IBRD countries)SudanSurinameSwazilandSwedenSwitzerlandSyrian Arab RepublicTajikistanTanzaniaThailandTimor-LesteTogoTongaTrinidad and TobagoTunisiaTurkeyUgandaUkraineUnited Arab EmiratesUpper middle incomeUruguayUzbekistanVanuatuVenezuela, RBVietnamWest Bank and GazaWorldYemen, Rep.ZambiaZimbabwe Linha do tempo:
Nesta escala de tempo está apresentado um gráfico de 1972 ano até 2014 ano Burkina Faso. Dados de 1971 ano ausente. O número de observações reais por data: 35.
Fonte (nome):
Indicadores de desenvolvimento mundial
Fonte (organização):
UNESCO Institute for Statistics
Categorias:
Education, Gender
Foi atualizado:
23 abr 2017 ano
Indicadores de alterações dos valores ao longo dos anos
Mínimo:
33.184
1 jan 1973 ano
Máximo:
74.631
1 jan 2014 ano
Na data de observação
Valor
Mudança absoluta
A alteração em relação ao valor anterior
1 jan 1972 ano
39.574
+39.574
0.0%
1 jan 1973 ano
33.184
-6.39
-16.15%
1 jan 1974 ano
34.559
+1.375
4.14%
1 jan 1975 ano
34.363
-0.196
-0.57%
1 jan 1976 ano
39.32
+4.957
14.43%
1 jan 1977 ano
38.554
-0.766
-1.95%
1 jan 1978 ano
45.045
+6.491
16.84%
1 jan 1979 ano
40.391
-4.655
-10.33%
1 jan 1980 ano
42.665
+2.274
5.63%
1 jan 1981 ano
38.332
-4.333
-10.16%
1 jan 1982 ano
38.945
+0.614
1.6%
1 jan 1983 ano
37.049
-1.897
-4.87%
1 jan 1984 ano
36.38
-0.669
-1.8%
1 jan 1985 ano
39.932
+3.552
9.76%
1 jan 1986 ano
34.992
-4.939
-12.37%
1 jan 1988 ano
38.979
+3.987
11.39%
1 jan 1990 ano
39.103
+0.124
0.32%
1 jan 1991 ano
45.689
+6.586
16.84%
1 jan 1992 ano
48.107
+2.417
5.29%
1 jan 1997 ano
43.9
-4.207
-8.74%
1 jan 1999 ano
61.33
+17.43
39.7%
1 jan 2000 ano
63.423
+2.093
3.41%
1 jan 2001 ano
63.393
-0.03
-0.05%
1 jan 2002 ano
61.297
-2.097
-3.31%
1 jan 2003 ano
68.554
+7.258
11.84%
1 jan 2004 ano
71.32
+2.765
4.03%
1 jan 2005 ano
70.161
-1.158
-1.62%
1 jan 2006 ano
66.181
-3.981
-5.67%
1 jan 2007 ano
73.842
+7.662
11.58%
1 jan 2008 ano
70.681
-3.161
-4.28%
1 jan 2009 ano
71.539
+0.857
1.21%
1 jan 2010 ano
66.599
-4.939
-6.9%
1 jan 2012 ano
72.785
+6.186
9.29%
1 jan 2013 ano
74.571
+1.785
2.45%
1 jan 2014 ano
74.631
+0.06
0.08%
Classificação de países por estatísticas atuais por anos


Comentários: