29
/pt/
pt
AIzaSyAYiBZKx7MnpbEhh9jyipgxe19OcubqV5w
April 1, 2024
43033
Latin America & Caribbean (excluding high income)
LAC
false
2
1
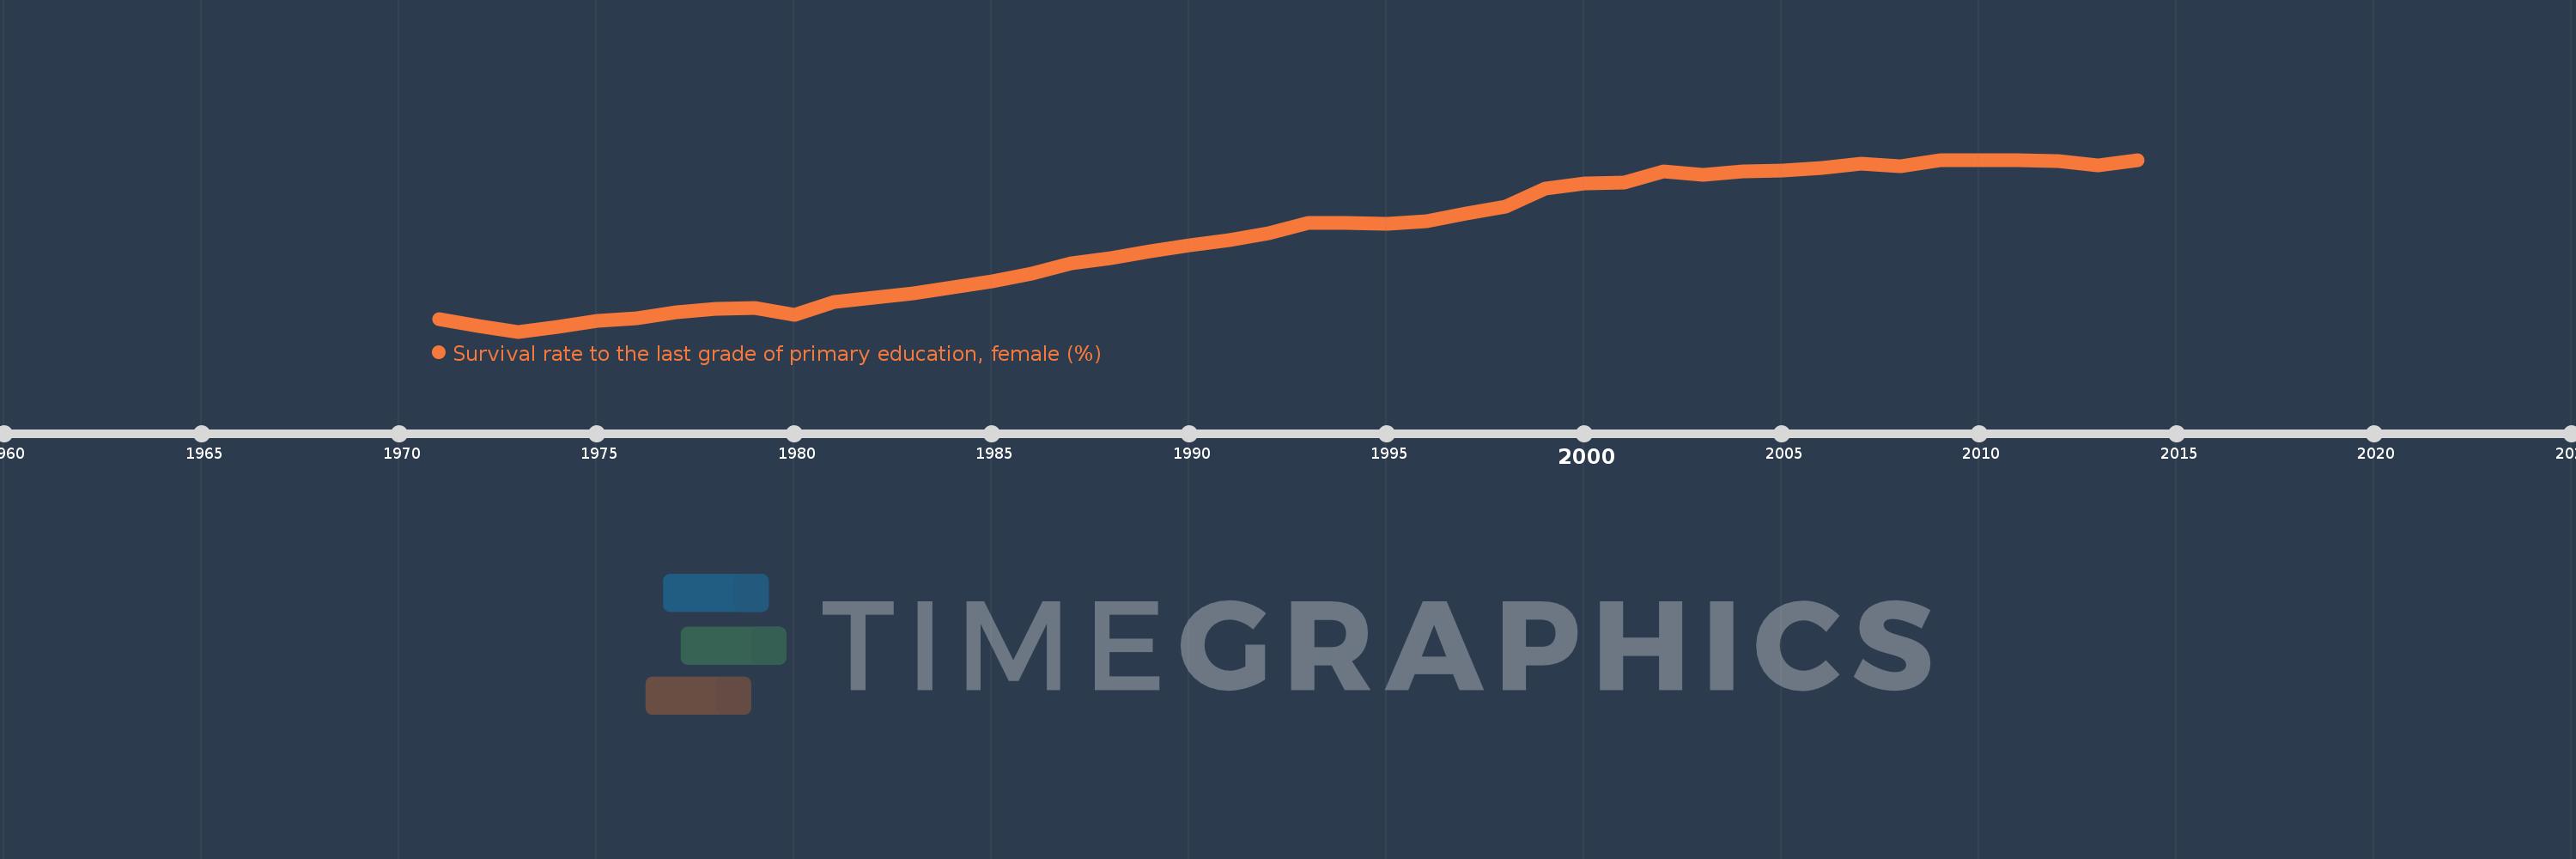
Survival rate to the last grade of primary education, female (%)
2014,2013,2012,2011,2010,2009,2008,2007,2006,2005,2004,2003,2002,2001,2000,1999,1998,1997,1996,1995,1994,1993,1992,1991,1990,1989,1988,1987,1986,1985,1984,1983,1982,1981,1980,1979,1978,1977,1976,1975,1974,1973,1972,1971
Estas estatísticas em outros países:
AfghanistanAlbaniaAlgeriaAndorraAngolaArab WorldArgentinaArmeniaArubaAustriaAzerbaijanBahamas, TheBahrainBangladeshBarbadosBelarusBelgiumBelizeBeninBermudaBhutanBoliviaBosnia and HerzegovinaBotswanaBrazilBrunei DarussalamBulgariaBurkina FasoBurundiCabo VerdeCambodiaCameroonCanadaCaribbean small statesCentral African RepublicCentral Europe and the BalticsChadChileChinaColombiaComorosCongo, Dem. Rep.Congo, Rep.Costa RicaCote d'IvoireCroatiaCubaCyprusCzech RepublicDenmarkDjiboutiDominicaDominican RepublicEarly-demographic dividendEast Asia & PacificEast Asia & Pacific (excluding high income)East Asia & Pacific (IDA & IBRD countries)EcuadorEgypt, Arab Rep.El SalvadorEquatorial GuineaEritreaEstoniaEthiopiaEuro areaEurope & Central AsiaEurope & Central Asia (excluding high income)Europe & Central Asia (IDA & IBRD countries)European UnionFijiFinlandFragile and conflict affected situationsFranceGabonGambia, TheGeorgiaGermanyGhanaGreeceGuatemalaGuineaGuinea-BissauGuyanaHaitiHeavily indebted poor countries (HIPC)High incomeHondurasHong Kong SAR, ChinaHungaryIBRD onlyIcelandIDA & IBRD totalIDA blendIDA onlyIDA totalIndiaIndonesiaIran, Islamic Rep.IraqIsraelItalyJamaicaJapanJordanKazakhstanKenyaKiribatiKorea, Rep.KuwaitKyrgyz RepublicLao PDRLate-demographic dividendLatin America & Caribbean Latin America & Caribbean (excluding high income)Latin America & the Caribbean (IDA & IBRD countries)LatviaLeast developed countries: UN classificationLebanonLesothoLiberiaLibyaLiechtensteinLithuaniaLow & middle incomeLow incomeLower middle incomeLuxembourgMacao SAR, ChinaMacedonia, FYRMadagascarMalawiMalaysiaMaldivesMaliMaltaMarshall IslandsMauritaniaMauritiusMexicoMiddle East & North AfricaMiddle East & North Africa (excluding high income)Middle East & North Africa (IDA & IBRD countries)Middle incomeMoldovaMongoliaMontenegroMoroccoMozambiqueMyanmarNamibiaNepalNetherlandsNicaraguaNigerNigeriaNorth AmericaNorwayOECD membersOmanOther small statesPacific island small statesPakistanPanamaPapua New GuineaParaguayPeruPhilippinesPolandPortugalPost-demographic dividendPre-demographic dividendQatarRomaniaRussian FederationRwandaSamoaSan MarinoSao Tome and PrincipeSaudi ArabiaSenegalSerbiaSeychellesSierra LeoneSingaporeSlovak RepublicSloveniaSmall statesSolomon IslandsSouth AfricaSouth AsiaSouth Asia (IDA & IBRD)SpainSri LankaSt. Kitts and NevisSt. LuciaSt. Vincent and the GrenadinesSub-Saharan Africa Sub-Saharan Africa (excluding high income)Sub-Saharan Africa (IDA & IBRD countries)SudanSurinameSwazilandSwedenSwitzerlandSyrian Arab RepublicTajikistanTanzaniaThailandTimor-LesteTogoTongaTrinidad and TobagoTunisiaTurkeyUgandaUkraineUnited Arab EmiratesUpper middle incomeUruguayUzbekistanVanuatuVenezuela, RBVietnamWest Bank and GazaWorldYemen, Rep.ZambiaZimbabwe Linha do tempo:
Nesta escala de tempo está apresentado um gráfico de 1971 ano até 2014 ano Latin America & Caribbean (excluding high income). Dados de 1970 ano ausente. O número de observações reais por data: 44.
Fonte (nome):
Indicadores de desenvolvimento mundial
Fonte (organização):
UNESCO Institute for Statistics
Categorias:
Education, Gender
Foi atualizado:
23 abr 2017 ano
Indicadores de alterações dos valores ao longo dos anos
Mínimo:
40.282
1 jan 1973 ano
Máximo:
85.084
1 jan 2010 ano
Na data de observação
Valor
Mudança absoluta
A alteração em relação ao valor anterior
1 jan 1971 ano
43.627
+43.627
0.0%
1 jan 1972 ano
41.697
-1.93
-4.42%
1 jan 1973 ano
40.282
-1.415
-3.39%
1 jan 1974 ano
41.536
+1.254
3.11%
1 jan 1975 ano
43.118
+1.581
3.81%
1 jan 1976 ano
43.839
+0.721
1.67%
1 jan 1977 ano
45.409
+1.57
3.58%
1 jan 1978 ano
46.314
+0.905
1.99%
1 jan 1979 ano
46.534
+0.219
0.47%
1 jan 1980 ano
44.619
-1.914
-4.11%
1 jan 1981 ano
47.982
+3.362
7.54%
1 jan 1982 ano
49.107
+1.126
2.35%
1 jan 1983 ano
50.362
+1.254
2.55%
1 jan 1984 ano
51.72
+1.358
2.7%
1 jan 1985 ano
53.35
+1.63
3.15%
1 jan 1986 ano
55.417
+2.067
3.87%
1 jan 1987 ano
58.043
+2.626
4.74%
1 jan 1988 ano
59.443
+1.4
2.41%
1 jan 1989 ano
61.193
+1.75
2.94%
1 jan 1990 ano
62.708
+1.514
2.47%
1 jan 1991 ano
64.107
+1.399
2.23%
1 jan 1992 ano
65.912
+1.805
2.82%
1 jan 1993 ano
68.666
+2.754
4.18%
1 jan 1994 ano
68.731
+0.065
0.09%
1 jan 1995 ano
68.476
-0.255
-0.37%
1 jan 1996 ano
69.108
+0.632
0.92%
1 jan 1997 ano
71.139
+2.031
2.94%
1 jan 1998 ano
72.976
+1.837
2.58%
1 jan 1999 ano
77.485
+4.509
6.18%
1 jan 2000 ano
79.024
+1.539
1.99%
1 jan 2001 ano
79.134
+0.11
0.14%
1 jan 2002 ano
82.044
+2.91
3.68%
1 jan 2003 ano
81.26
-0.784
-0.96%
1 jan 2004 ano
81.977
+0.717
0.88%
1 jan 2005 ano
82.324
+0.346
0.42%
1 jan 2006 ano
82.94
+0.616
0.75%
1 jan 2007 ano
84.185
+1.245
1.5%
1 jan 2008 ano
83.295
-0.89
-1.06%
1 jan 2009 ano
84.976
+1.681
2.02%
1 jan 2010 ano
85.084
+0.108
0.13%
1 jan 2011 ano
85.015
-0.069
-0.08%
1 jan 2012 ano
84.71
-0.305
-0.36%
1 jan 2013 ano
83.735
-0.976
-1.15%
1 jan 2014 ano
85.01
+1.276
1.52%
Classificação de países por estatísticas atuais por anos


Comentários: