29
/pt/
pt
AIzaSyAYiBZKx7MnpbEhh9jyipgxe19OcubqV5w
April 1, 2024
126948
El Salvador
SLV
true
2
1
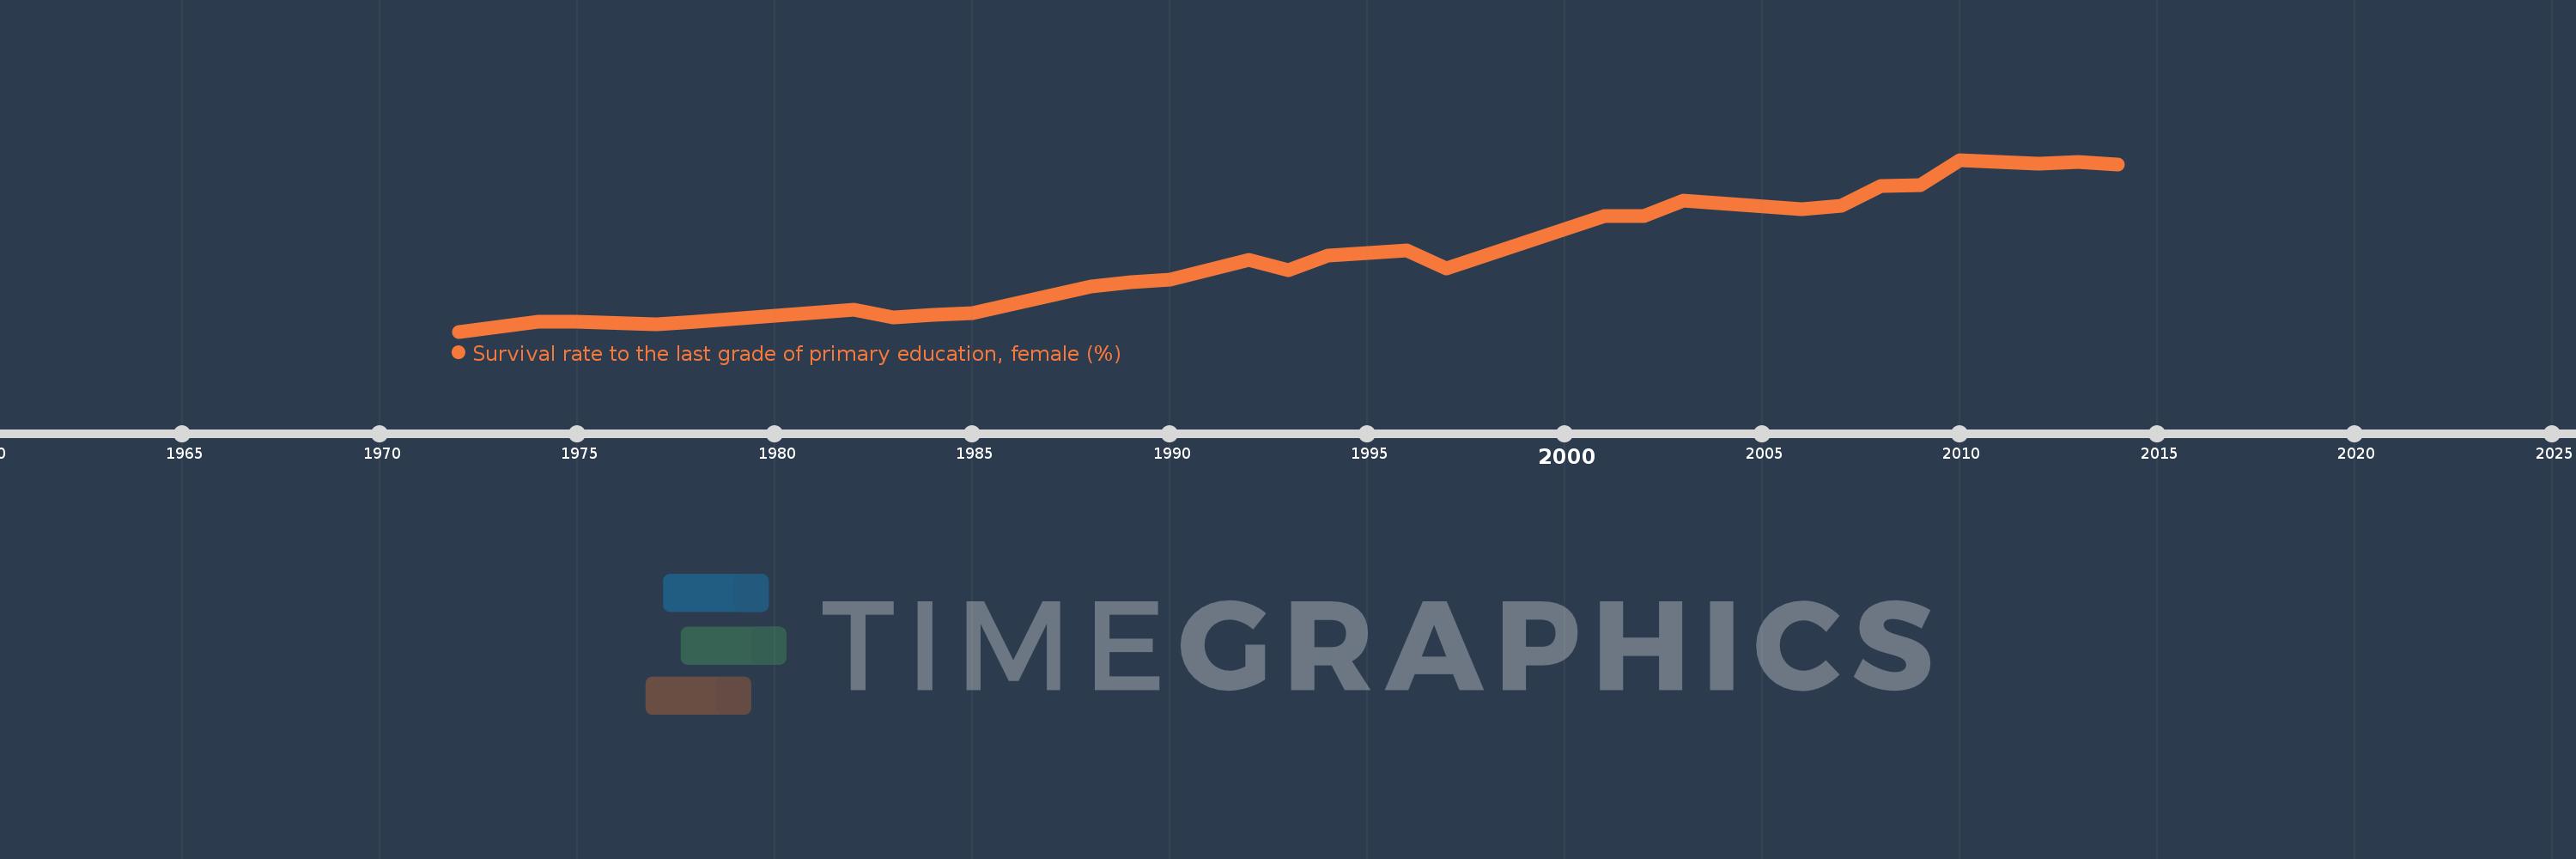
Survival rate to the last grade of primary education, female (%)
2014,2013,2012,2011,2010,2009,2008,2007,2006,2003,2002,2001,1997,1996,1994,1993,1992,1990,1989,1988,1985,1984,1983,1982,1978,1977,1975,1974,1973,1972
Estas estatísticas em outros países:
AfghanistanAlbaniaAlgeriaAndorraAngolaArab WorldArgentinaArmeniaArubaAustriaAzerbaijanBahamas, TheBahrainBangladeshBarbadosBelarusBelgiumBelizeBeninBermudaBhutanBoliviaBosnia and HerzegovinaBotswanaBrazilBrunei DarussalamBulgariaBurkina FasoBurundiCabo VerdeCambodiaCameroonCanadaCaribbean small statesCentral African RepublicCentral Europe and the BalticsChadChileChinaColombiaComorosCongo, Dem. Rep.Congo, Rep.Costa RicaCote d'IvoireCroatiaCubaCyprusCzech RepublicDenmarkDjiboutiDominicaDominican RepublicEarly-demographic dividendEast Asia & PacificEast Asia & Pacific (excluding high income)East Asia & Pacific (IDA & IBRD countries)EcuadorEgypt, Arab Rep.El SalvadorEquatorial GuineaEritreaEstoniaEthiopiaEuro areaEurope & Central AsiaEurope & Central Asia (excluding high income)Europe & Central Asia (IDA & IBRD countries)European UnionFijiFinlandFragile and conflict affected situationsFranceGabonGambia, TheGeorgiaGermanyGhanaGreeceGuatemalaGuineaGuinea-BissauGuyanaHaitiHeavily indebted poor countries (HIPC)High incomeHondurasHong Kong SAR, ChinaHungaryIBRD onlyIcelandIDA & IBRD totalIDA blendIDA onlyIDA totalIndiaIndonesiaIran, Islamic Rep.IraqIsraelItalyJamaicaJapanJordanKazakhstanKenyaKiribatiKorea, Rep.KuwaitKyrgyz RepublicLao PDRLate-demographic dividendLatin America & Caribbean Latin America & Caribbean (excluding high income)Latin America & the Caribbean (IDA & IBRD countries)LatviaLeast developed countries: UN classificationLebanonLesothoLiberiaLibyaLiechtensteinLithuaniaLow & middle incomeLow incomeLower middle incomeLuxembourgMacao SAR, ChinaMacedonia, FYRMadagascarMalawiMalaysiaMaldivesMaliMaltaMarshall IslandsMauritaniaMauritiusMexicoMiddle East & North AfricaMiddle East & North Africa (excluding high income)Middle East & North Africa (IDA & IBRD countries)Middle incomeMoldovaMongoliaMontenegroMoroccoMozambiqueMyanmarNamibiaNepalNetherlandsNicaraguaNigerNigeriaNorth AmericaNorwayOECD membersOmanOther small statesPacific island small statesPakistanPanamaPapua New GuineaParaguayPeruPhilippinesPolandPortugalPost-demographic dividendPre-demographic dividendQatarRomaniaRussian FederationRwandaSamoaSan MarinoSao Tome and PrincipeSaudi ArabiaSenegalSerbiaSeychellesSierra LeoneSingaporeSlovak RepublicSloveniaSmall statesSolomon IslandsSouth AfricaSouth AsiaSouth Asia (IDA & IBRD)SpainSri LankaSt. Kitts and NevisSt. LuciaSt. Vincent and the GrenadinesSub-Saharan Africa Sub-Saharan Africa (excluding high income)Sub-Saharan Africa (IDA & IBRD countries)SudanSurinameSwazilandSwedenSwitzerlandSyrian Arab RepublicTajikistanTanzaniaThailandTimor-LesteTogoTongaTrinidad and TobagoTunisiaTurkeyUgandaUkraineUnited Arab EmiratesUpper middle incomeUruguayUzbekistanVanuatuVenezuela, RBVietnamWest Bank and GazaWorldYemen, Rep.ZambiaZimbabwe Linha do tempo:
Nesta escala de tempo está apresentado um gráfico de 1972 ano até 2014 ano El Salvador. Dados de 1971 ano ausente. O número de observações reais por data: 30.
Fonte (nome):
Indicadores de desenvolvimento mundial
Fonte (organização):
UNESCO Institute for Statistics
Categorias:
Education, Gender
Foi atualizado:
23 abr 2017 ano
Indicadores de alterações dos valores ao longo dos anos
Mínimo:
26.827
1 jan 1972 ano
Máximo:
86.962
1 jan 2010 ano
Na data de observação
Valor
Mudança absoluta
A alteração em relação ao valor anterior
1 jan 1972 ano
26.827
+26.827
0.0%
1 jan 1973 ano
28.506
+1.68
6.26%
1 jan 1974 ano
30.184
+1.678
5.89%
1 jan 1975 ano
30.193
+0.008
0.03%
1 jan 1977 ano
29.433
-0.76
-2.52%
1 jan 1978 ano
30.216
+0.784
2.66%
1 jan 1982 ano
34.539
+4.322
14.31%
1 jan 1983 ano
31.812
-2.727
-7.9%
1 jan 1984 ano
32.737
+0.926
2.91%
1 jan 1985 ano
33.177
+0.44
1.34%
1 jan 1988 ano
42.469
+9.292
28.01%
1 jan 1989 ano
44.152
+1.683
3.96%
1 jan 1990 ano
44.956
+0.804
1.82%
1 jan 1992 ano
52.079
+7.123
15.85%
1 jan 1993 ano
48.284
-3.795
-7.29%
1 jan 1994 ano
53.575
+5.291
10.96%
1 jan 1996 ano
55.305
+1.729
3.23%
1 jan 1997 ano
49.035
-6.269
-11.34%
1 jan 2001 ano
67.353
+18.318
37.36%
1 jan 2002 ano
67.415
+0.062
0.09%
1 jan 2003 ano
72.739
+5.323
7.9%
1 jan 2006 ano
69.572
-3.167
-4.35%
1 jan 2007 ano
70.911
+1.339
1.92%
1 jan 2008 ano
77.707
+6.795
9.58%
1 jan 2009 ano
78.075
+0.368
0.47%
1 jan 2010 ano
86.962
+8.887
11.38%
1 jan 2011 ano
86.108
-0.854
-0.98%
1 jan 2012 ano
85.622
-0.486
-0.56%
1 jan 2013 ano
86.307
+0.685
0.8%
1 jan 2014 ano
85.23
-1.077
-1.25%
Classificação de países por estatísticas atuais por anos


Comentários: