29
/pt/
pt
AIzaSyAYiBZKx7MnpbEhh9jyipgxe19OcubqV5w
April 1, 2024
268739
Tunisia
TUN
true
2
1
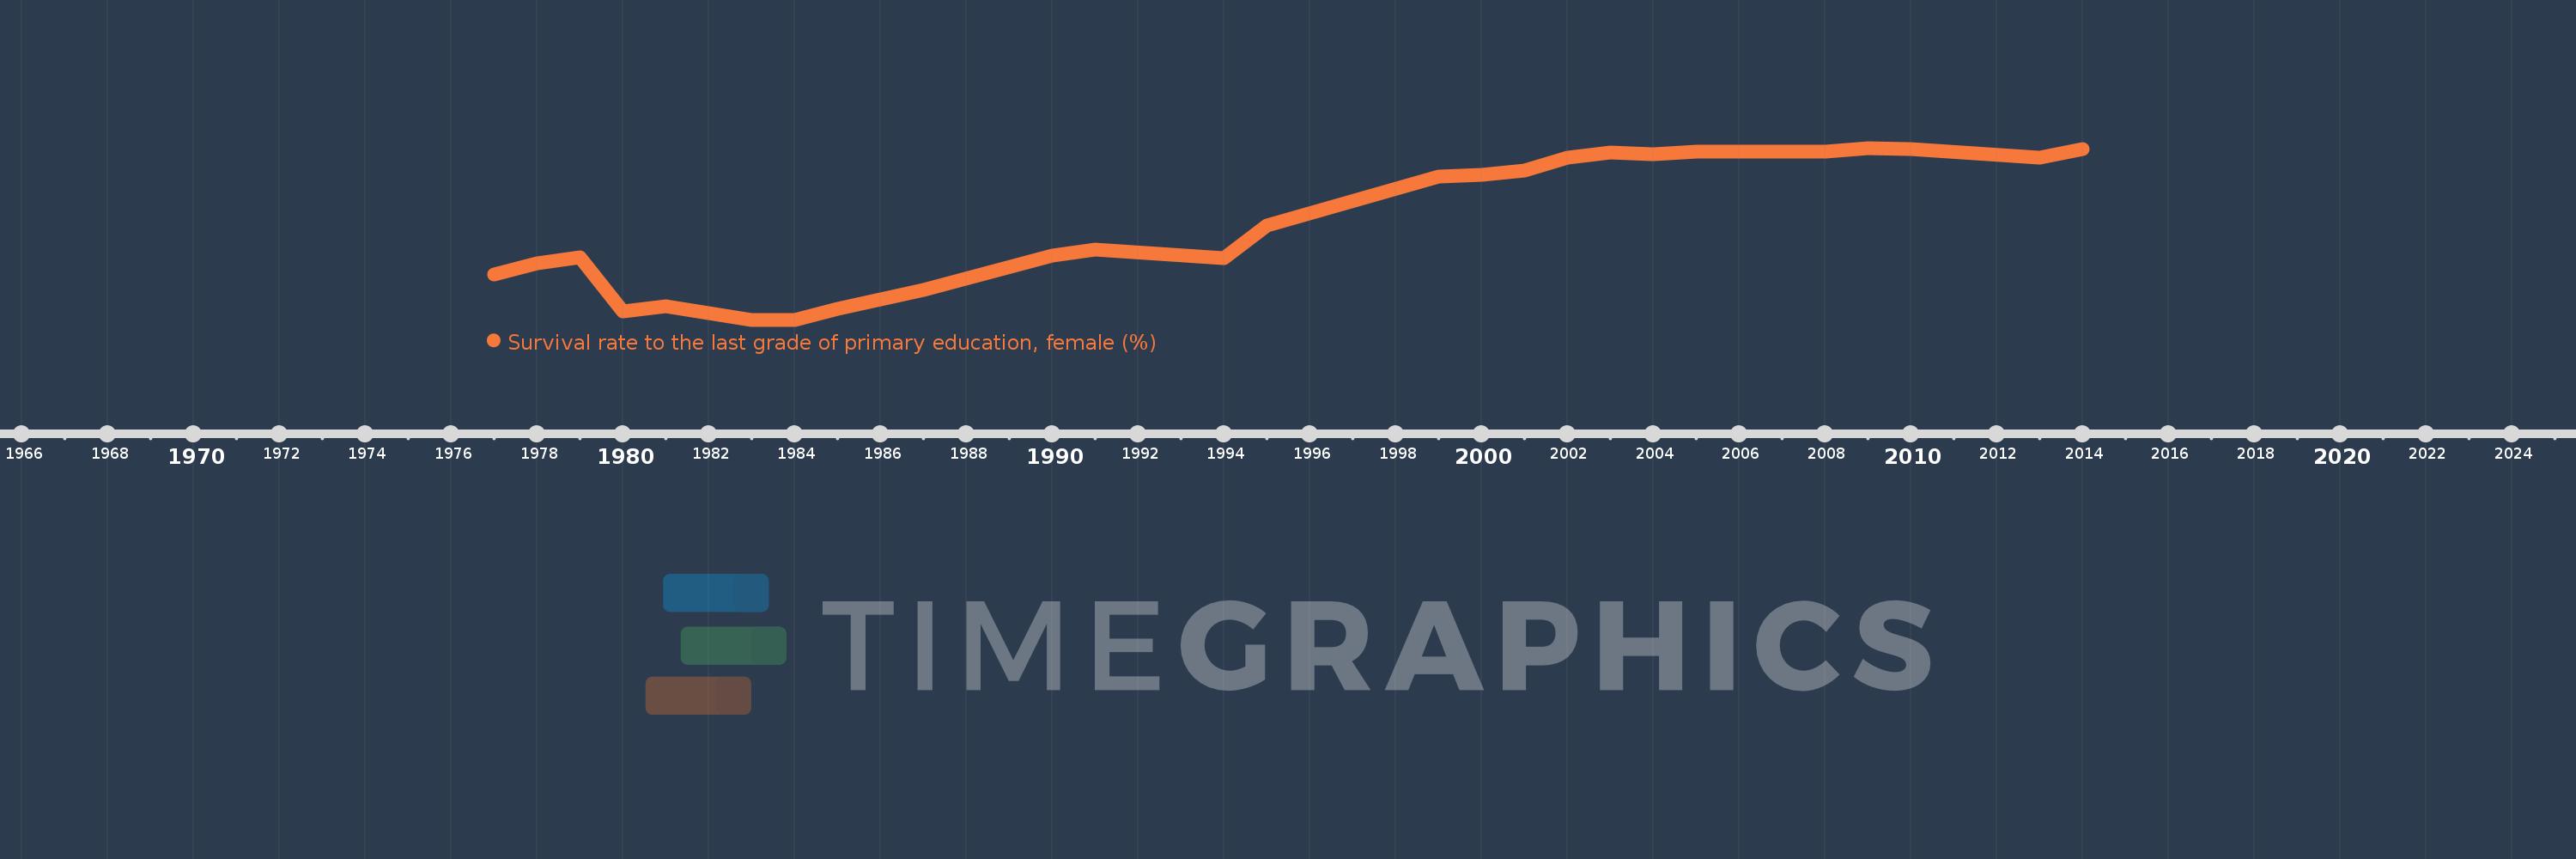
Survival rate to the last grade of primary education, female (%)
2014,2013,2010,2009,2008,2007,2005,2004,2003,2002,2001,2000,1999,1995,1994,1991,1990,1987,1986,1985,1984,1983,1981,1980,1979,1978,1977
Estas estatísticas em outros países:
AfghanistanAlbaniaAlgeriaAndorraAngolaArab WorldArgentinaArmeniaArubaAustriaAzerbaijanBahamas, TheBahrainBangladeshBarbadosBelarusBelgiumBelizeBeninBermudaBhutanBoliviaBosnia and HerzegovinaBotswanaBrazilBrunei DarussalamBulgariaBurkina FasoBurundiCabo VerdeCambodiaCameroonCanadaCaribbean small statesCentral African RepublicCentral Europe and the BalticsChadChileChinaColombiaComorosCongo, Dem. Rep.Congo, Rep.Costa RicaCote d'IvoireCroatiaCubaCyprusCzech RepublicDenmarkDjiboutiDominicaDominican RepublicEarly-demographic dividendEast Asia & PacificEast Asia & Pacific (excluding high income)East Asia & Pacific (IDA & IBRD countries)EcuadorEgypt, Arab Rep.El SalvadorEquatorial GuineaEritreaEstoniaEthiopiaEuro areaEurope & Central AsiaEurope & Central Asia (excluding high income)Europe & Central Asia (IDA & IBRD countries)European UnionFijiFinlandFragile and conflict affected situationsFranceGabonGambia, TheGeorgiaGermanyGhanaGreeceGuatemalaGuineaGuinea-BissauGuyanaHaitiHeavily indebted poor countries (HIPC)High incomeHondurasHong Kong SAR, ChinaHungaryIBRD onlyIcelandIDA & IBRD totalIDA blendIDA onlyIDA totalIndiaIndonesiaIran, Islamic Rep.IraqIsraelItalyJamaicaJapanJordanKazakhstanKenyaKiribatiKorea, Rep.KuwaitKyrgyz RepublicLao PDRLate-demographic dividendLatin America & Caribbean Latin America & Caribbean (excluding high income)Latin America & the Caribbean (IDA & IBRD countries)LatviaLeast developed countries: UN classificationLebanonLesothoLiberiaLibyaLiechtensteinLithuaniaLow & middle incomeLow incomeLower middle incomeLuxembourgMacao SAR, ChinaMacedonia, FYRMadagascarMalawiMalaysiaMaldivesMaliMaltaMarshall IslandsMauritaniaMauritiusMexicoMiddle East & North AfricaMiddle East & North Africa (excluding high income)Middle East & North Africa (IDA & IBRD countries)Middle incomeMoldovaMongoliaMontenegroMoroccoMozambiqueMyanmarNamibiaNepalNetherlandsNicaraguaNigerNigeriaNorth AmericaNorwayOECD membersOmanOther small statesPacific island small statesPakistanPanamaPapua New GuineaParaguayPeruPhilippinesPolandPortugalPost-demographic dividendPre-demographic dividendQatarRomaniaRussian FederationRwandaSamoaSan MarinoSao Tome and PrincipeSaudi ArabiaSenegalSerbiaSeychellesSierra LeoneSingaporeSlovak RepublicSloveniaSmall statesSolomon IslandsSouth AfricaSouth AsiaSouth Asia (IDA & IBRD)SpainSri LankaSt. Kitts and NevisSt. LuciaSt. Vincent and the GrenadinesSub-Saharan Africa Sub-Saharan Africa (excluding high income)Sub-Saharan Africa (IDA & IBRD countries)SudanSurinameSwazilandSwedenSwitzerlandSyrian Arab RepublicTajikistanTanzaniaThailandTimor-LesteTogoTongaTrinidad and TobagoTunisiaTurkeyUgandaUkraineUnited Arab EmiratesUpper middle incomeUruguayUzbekistanVanuatuVenezuela, RBVietnamWest Bank and GazaWorldYemen, Rep.ZambiaZimbabwe Linha do tempo:
Nesta escala de tempo está apresentado um gráfico de 1977 ano até 2014 ano Tunisia. Dados de 1976 ano ausente. O número de observações reais por data: 27.
Fonte (nome):
Indicadores de desenvolvimento mundial
Fonte (organização):
UNESCO Institute for Statistics
Categorias:
Education, Gender
Foi atualizado:
23 abr 2017 ano
Indicadores de alterações dos valores ao longo dos anos
Mínimo:
49.813
1 jan 1983 ano
Máximo:
95.481
1 jan 2009 ano
Na data de observação
Valor
Mudança absoluta
A alteração em relação ao valor anterior
1 jan 1977 ano
61.832
+61.832
0.0%
1 jan 1978 ano
64.721
+2.889
4.67%
1 jan 1979 ano
66.393
+1.673
2.58%
1 jan 1980 ano
52.098
-14.295
-21.53%
1 jan 1981 ano
53.438
+1.34
2.57%
1 jan 1983 ano
49.813
-3.625
-6.78%
1 jan 1984 ano
49.852
+0.039
0.08%
1 jan 1985 ano
52.61
+2.758
5.53%
1 jan 1986 ano
55.212
+2.603
4.95%
1 jan 1987 ano
57.682
+2.47
4.47%
1 jan 1990 ano
66.926
+9.244
16.03%
1 jan 1991 ano
68.581
+1.656
2.47%
1 jan 1994 ano
66.157
-2.424
-3.53%
1 jan 1995 ano
74.919
+8.762
13.24%
1 jan 1999 ano
87.922
+13.002
17.35%
1 jan 2000 ano
88.321
+0.399
0.45%
1 jan 2001 ano
89.539
+1.218
1.38%
1 jan 2002 ano
92.792
+3.253
3.63%
1 jan 2003 ano
94.181
+1.389
1.5%
1 jan 2004 ano
93.821
-0.36
-0.38%
1 jan 2005 ano
94.413
+0.592
0.63%
1 jan 2007 ano
94.398
-0.015
-0.02%
1 jan 2008 ano
94.613
+0.215
0.23%
1 jan 2009 ano
95.481
+0.868
0.92%
1 jan 2010 ano
95.141
-0.34
-0.36%
1 jan 2013 ano
93.009
-2.132
-2.24%
1 jan 2014 ano
95.176
+2.167
2.33%
Classificação de países por estatísticas atuais por anos


Comentários: