29
/pt/
pt
AIzaSyAYiBZKx7MnpbEhh9jyipgxe19OcubqV5w
April 1, 2024
49629
Middle East & North Africa (excluding high income)
MNA
false
2
1
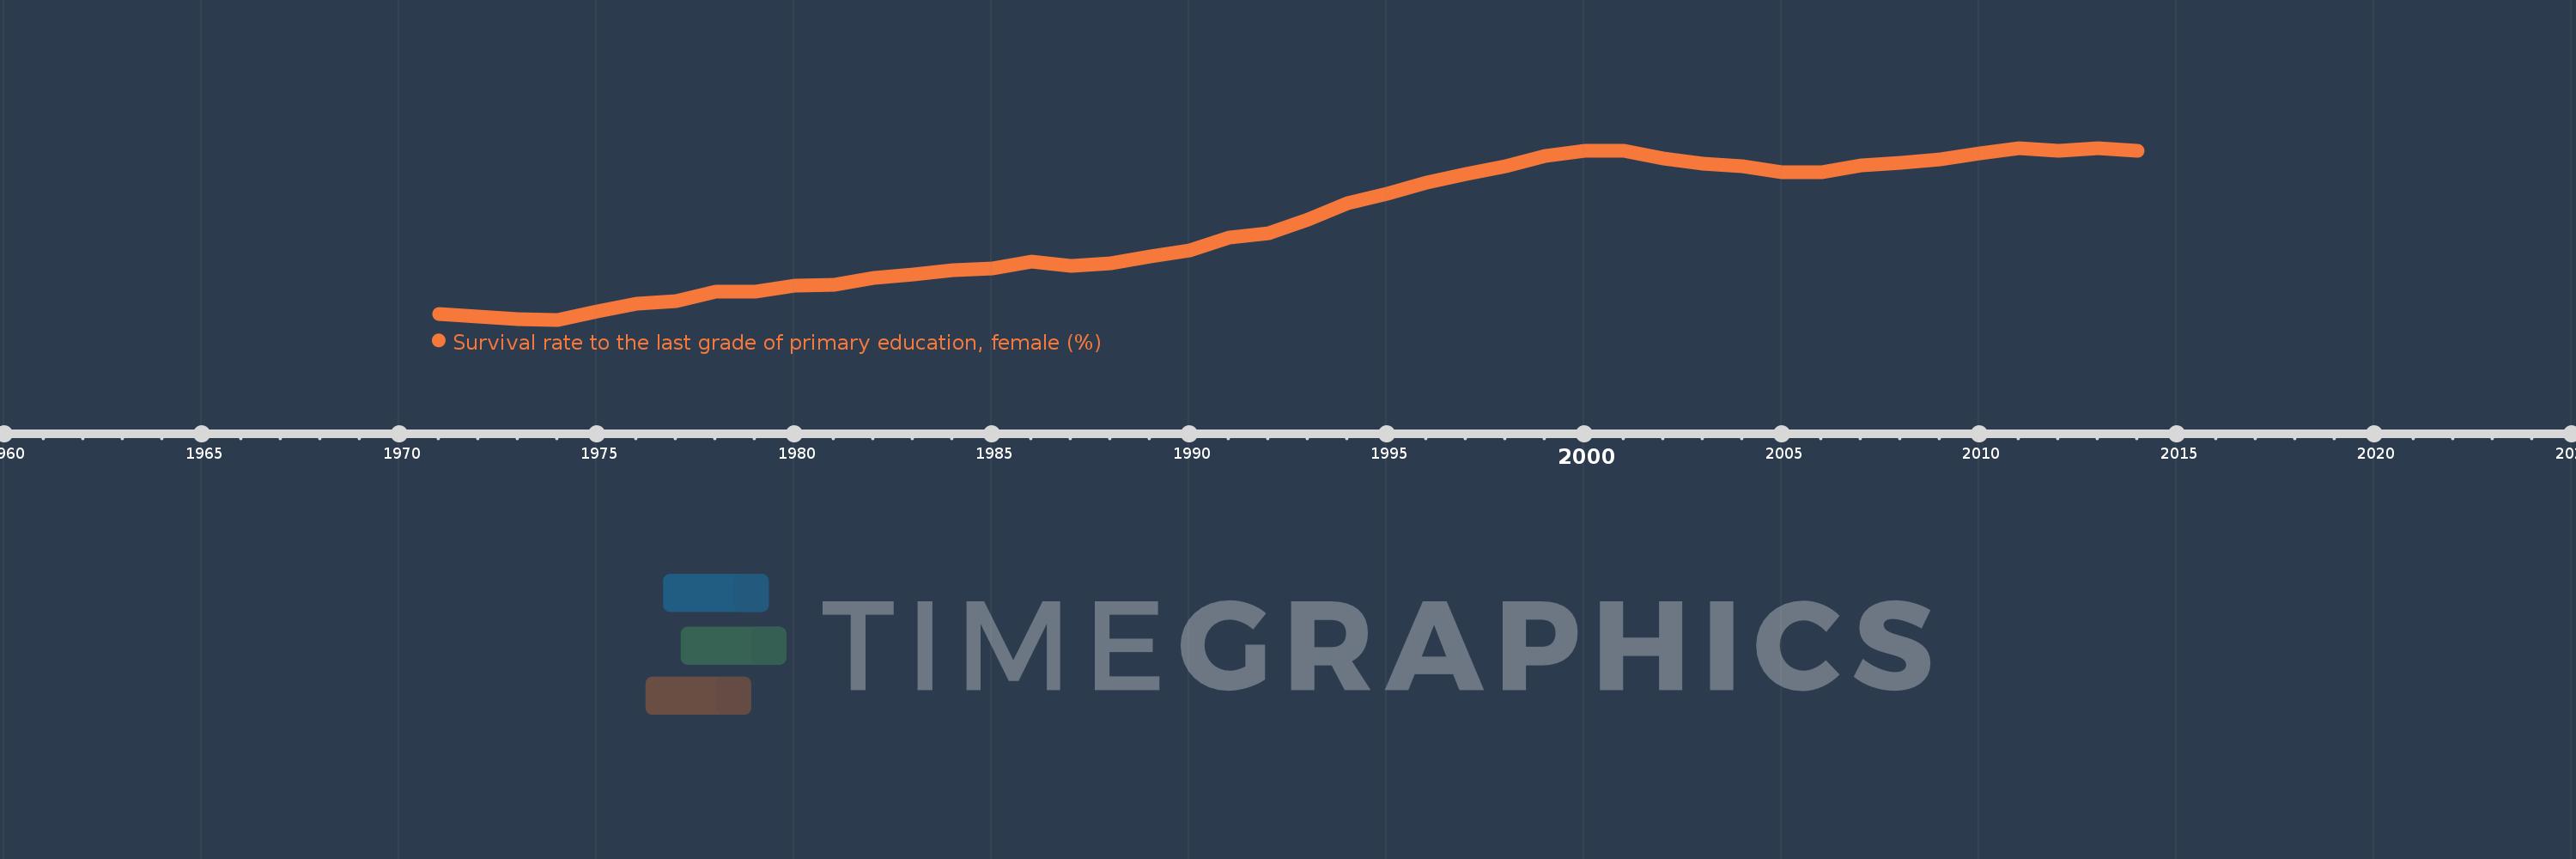
Survival rate to the last grade of primary education, female (%)
2014,2013,2012,2011,2010,2009,2008,2007,2006,2005,2004,2003,2002,2001,2000,1999,1998,1997,1996,1995,1994,1993,1992,1991,1990,1989,1988,1987,1986,1985,1984,1983,1982,1981,1980,1979,1978,1977,1976,1975,1974,1973,1972,1971
Estas estatísticas em outros países:
AfghanistanAlbaniaAlgeriaAndorraAngolaArab WorldArgentinaArmeniaArubaAustriaAzerbaijanBahamas, TheBahrainBangladeshBarbadosBelarusBelgiumBelizeBeninBermudaBhutanBoliviaBosnia and HerzegovinaBotswanaBrazilBrunei DarussalamBulgariaBurkina FasoBurundiCabo VerdeCambodiaCameroonCanadaCaribbean small statesCentral African RepublicCentral Europe and the BalticsChadChileChinaColombiaComorosCongo, Dem. Rep.Congo, Rep.Costa RicaCote d'IvoireCroatiaCubaCyprusCzech RepublicDenmarkDjiboutiDominicaDominican RepublicEarly-demographic dividendEast Asia & PacificEast Asia & Pacific (excluding high income)East Asia & Pacific (IDA & IBRD countries)EcuadorEgypt, Arab Rep.El SalvadorEquatorial GuineaEritreaEstoniaEthiopiaEuro areaEurope & Central AsiaEurope & Central Asia (excluding high income)Europe & Central Asia (IDA & IBRD countries)European UnionFijiFinlandFragile and conflict affected situationsFranceGabonGambia, TheGeorgiaGermanyGhanaGreeceGuatemalaGuineaGuinea-BissauGuyanaHaitiHeavily indebted poor countries (HIPC)High incomeHondurasHong Kong SAR, ChinaHungaryIBRD onlyIcelandIDA & IBRD totalIDA blendIDA onlyIDA totalIndiaIndonesiaIran, Islamic Rep.IraqIsraelItalyJamaicaJapanJordanKazakhstanKenyaKiribatiKorea, Rep.KuwaitKyrgyz RepublicLao PDRLate-demographic dividendLatin America & Caribbean Latin America & Caribbean (excluding high income)Latin America & the Caribbean (IDA & IBRD countries)LatviaLeast developed countries: UN classificationLebanonLesothoLiberiaLibyaLiechtensteinLithuaniaLow & middle incomeLow incomeLower middle incomeLuxembourgMacao SAR, ChinaMacedonia, FYRMadagascarMalawiMalaysiaMaldivesMaliMaltaMarshall IslandsMauritaniaMauritiusMexicoMiddle East & North AfricaMiddle East & North Africa (excluding high income)Middle East & North Africa (IDA & IBRD countries)Middle incomeMoldovaMongoliaMontenegroMoroccoMozambiqueMyanmarNamibiaNepalNetherlandsNicaraguaNigerNigeriaNorth AmericaNorwayOECD membersOmanOther small statesPacific island small statesPakistanPanamaPapua New GuineaParaguayPeruPhilippinesPolandPortugalPost-demographic dividendPre-demographic dividendQatarRomaniaRussian FederationRwandaSamoaSan MarinoSao Tome and PrincipeSaudi ArabiaSenegalSerbiaSeychellesSierra LeoneSingaporeSlovak RepublicSloveniaSmall statesSolomon IslandsSouth AfricaSouth AsiaSouth Asia (IDA & IBRD)SpainSri LankaSt. Kitts and NevisSt. LuciaSt. Vincent and the GrenadinesSub-Saharan Africa Sub-Saharan Africa (excluding high income)Sub-Saharan Africa (IDA & IBRD countries)SudanSurinameSwazilandSwedenSwitzerlandSyrian Arab RepublicTajikistanTanzaniaThailandTimor-LesteTogoTongaTrinidad and TobagoTunisiaTurkeyUgandaUkraineUnited Arab EmiratesUpper middle incomeUruguayUzbekistanVanuatuVenezuela, RBVietnamWest Bank and GazaWorldYemen, Rep.ZambiaZimbabwe Linha do tempo:
Nesta escala de tempo está apresentado um gráfico de 1971 ano até 2014 ano Middle East & North Africa (excluding high income). Dados de 1970 ano ausente. O número de observações reais por data: 44.
Fonte (nome):
Indicadores de desenvolvimento mundial
Fonte (organização):
UNESCO Institute for Statistics
Categorias:
Education, Gender
Foi atualizado:
23 abr 2017 ano
Indicadores de alterações dos valores ao longo dos anos
Mínimo:
51.065
1 jan 1974 ano
Máximo:
86.373
1 jan 2011 ano
Na data de observação
Valor
Mudança absoluta
A alteração em relação ao valor anterior
1 jan 1971 ano
52.297
+52.297
0.0%
1 jan 1972 ano
51.66
-0.637
-1.22%
1 jan 1973 ano
51.219
-0.441
-0.85%
1 jan 1974 ano
51.065
-0.154
-0.3%
1 jan 1975 ano
52.724
+1.659
3.25%
1 jan 1976 ano
54.426
+1.702
3.23%
1 jan 1977 ano
54.893
+0.467
0.86%
1 jan 1978 ano
56.804
+1.911
3.48%
1 jan 1979 ano
56.898
+0.094
0.17%
1 jan 1980 ano
58.025
+1.127
1.98%
1 jan 1981 ano
58.259
+0.235
0.4%
1 jan 1982 ano
59.696
+1.437
2.47%
1 jan 1983 ano
60.411
+0.715
1.2%
1 jan 1984 ano
61.175
+0.764
1.26%
1 jan 1985 ano
61.545
+0.37
0.6%
1 jan 1986 ano
63.067
+1.522
2.47%
1 jan 1987 ano
62.221
-0.847
-1.34%
1 jan 1988 ano
62.652
+0.431
0.69%
1 jan 1989 ano
64.062
+1.411
2.25%
1 jan 1990 ano
65.339
+1.277
1.99%
1 jan 1991 ano
67.906
+2.567
3.93%
1 jan 1992 ano
68.868
+0.962
1.42%
1 jan 1993 ano
71.664
+2.796
4.06%
1 jan 1994 ano
74.944
+3.28
4.58%
1 jan 1995 ano
77.049
+2.104
2.81%
1 jan 1996 ano
79.247
+2.198
2.85%
1 jan 1997 ano
81.013
+1.766
2.23%
1 jan 1998 ano
82.582
+1.569
1.94%
1 jan 1999 ano
84.802
+2.22
2.69%
1 jan 2000 ano
85.817
+1.015
1.2%
1 jan 2001 ano
85.709
-0.109
-0.13%
1 jan 2002 ano
84.167
-1.542
-1.8%
1 jan 2003 ano
83.143
-1.024
-1.22%
1 jan 2004 ano
82.527
-0.616
-0.74%
1 jan 2005 ano
81.387
-1.14
-1.38%
1 jan 2006 ano
81.356
-0.03
-0.04%
1 jan 2007 ano
82.734
+1.378
1.69%
1 jan 2008 ano
83.317
+0.583
0.7%
1 jan 2009 ano
84.019
+0.703
0.84%
1 jan 2010 ano
85.197
+1.178
1.4%
1 jan 2011 ano
86.373
+1.176
1.38%
1 jan 2012 ano
85.871
-0.502
-0.58%
1 jan 2013 ano
86.298
+0.427
0.5%
1 jan 2014 ano
85.718
-0.581
-0.67%
Classificação de países por estatísticas atuais por anos


Comentários: