29
/pt/
pt
AIzaSyAYiBZKx7MnpbEhh9jyipgxe19OcubqV5w
April 1, 2024
63063
World
WLD
false
2
1
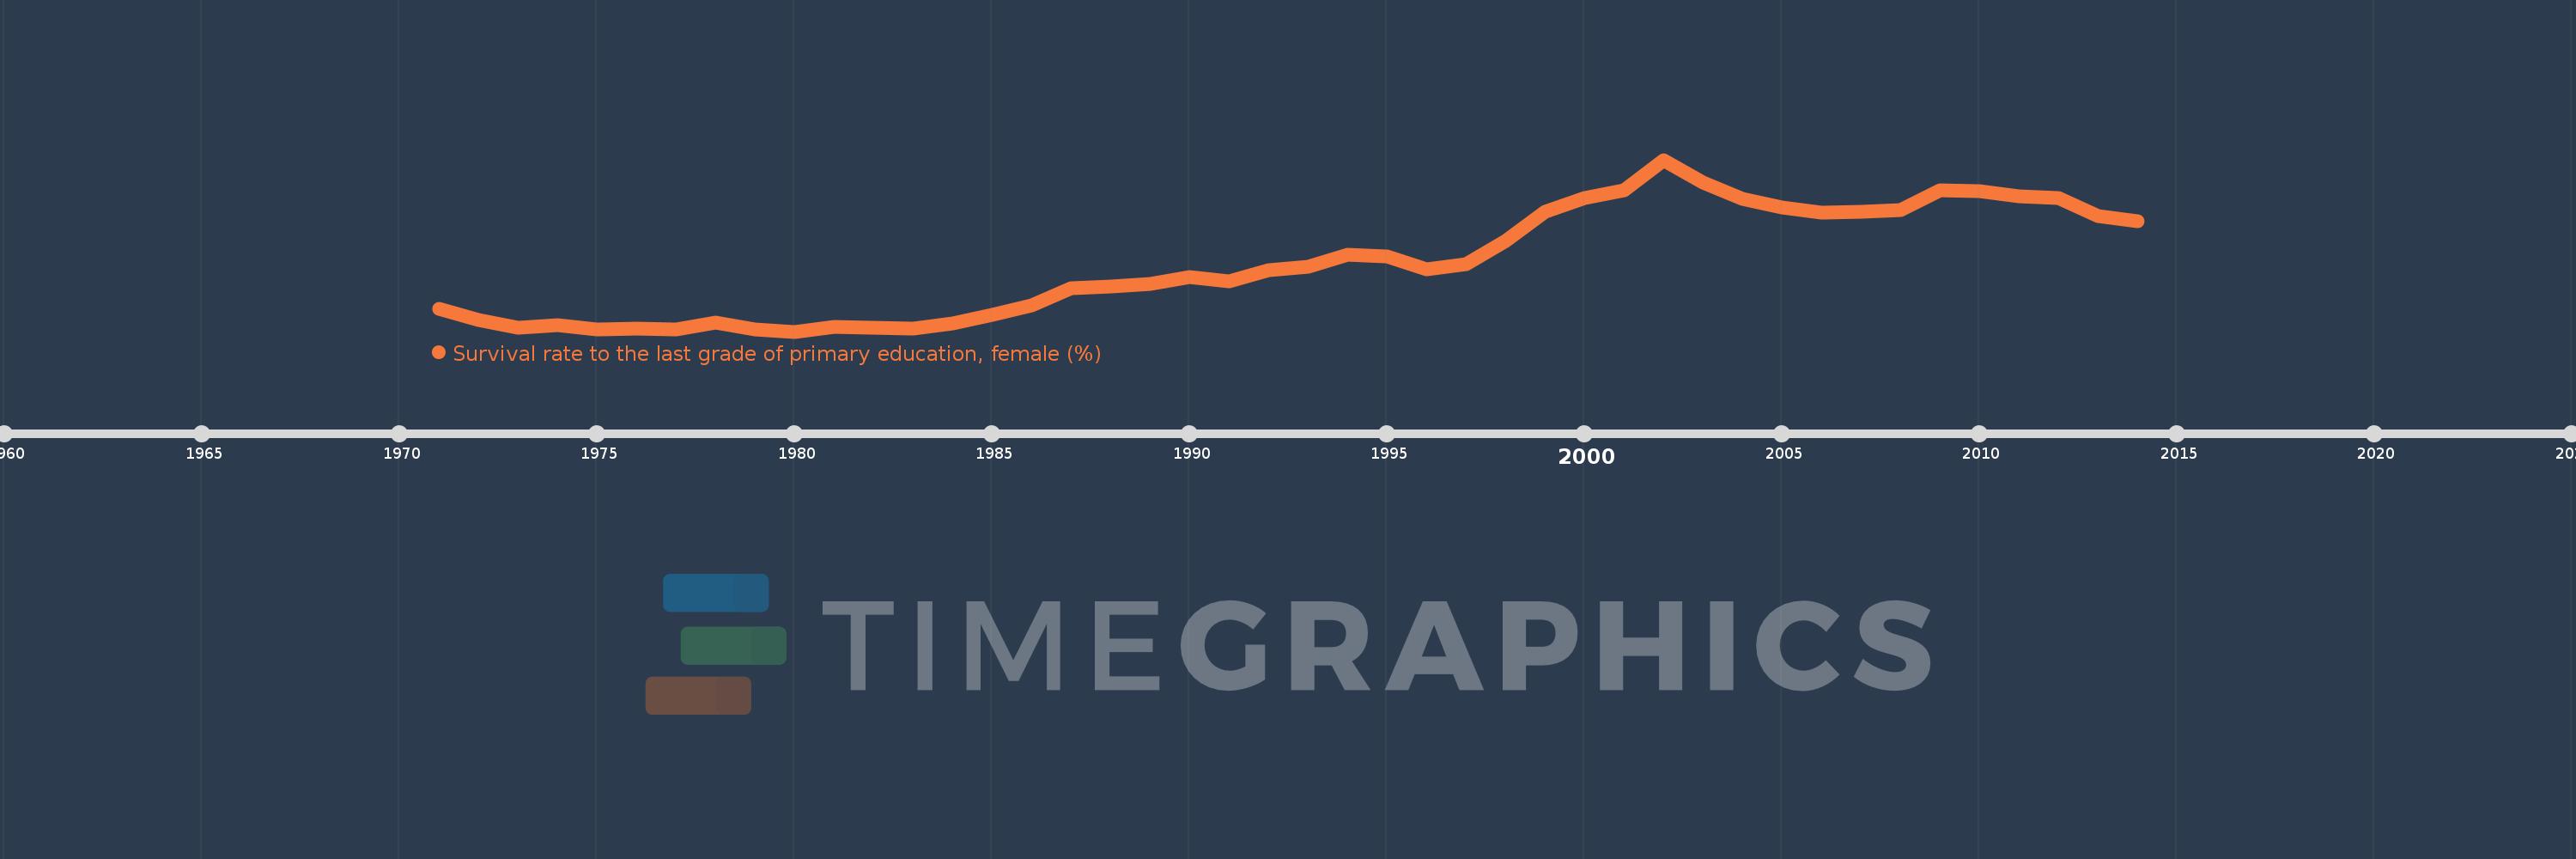
Survival rate to the last grade of primary education, female (%)
2014,2013,2012,2011,2010,2009,2008,2007,2006,2005,2004,2003,2002,2001,2000,1999,1998,1997,1996,1995,1994,1993,1992,1991,1990,1989,1988,1987,1986,1985,1984,1983,1982,1981,1980,1979,1978,1977,1976,1975,1974,1973,1972,1971
Estas estatísticas em outros países:
AfghanistanAlbaniaAlgeriaAndorraAngolaArab WorldArgentinaArmeniaArubaAustriaAzerbaijanBahamas, TheBahrainBangladeshBarbadosBelarusBelgiumBelizeBeninBermudaBhutanBoliviaBosnia and HerzegovinaBotswanaBrazilBrunei DarussalamBulgariaBurkina FasoBurundiCabo VerdeCambodiaCameroonCanadaCaribbean small statesCentral African RepublicCentral Europe and the BalticsChadChileChinaColombiaComorosCongo, Dem. Rep.Congo, Rep.Costa RicaCote d'IvoireCroatiaCubaCyprusCzech RepublicDenmarkDjiboutiDominicaDominican RepublicEarly-demographic dividendEast Asia & PacificEast Asia & Pacific (excluding high income)East Asia & Pacific (IDA & IBRD countries)EcuadorEgypt, Arab Rep.El SalvadorEquatorial GuineaEritreaEstoniaEthiopiaEuro areaEurope & Central AsiaEurope & Central Asia (excluding high income)Europe & Central Asia (IDA & IBRD countries)European UnionFijiFinlandFragile and conflict affected situationsFranceGabonGambia, TheGeorgiaGermanyGhanaGreeceGuatemalaGuineaGuinea-BissauGuyanaHaitiHeavily indebted poor countries (HIPC)High incomeHondurasHong Kong SAR, ChinaHungaryIBRD onlyIcelandIDA & IBRD totalIDA blendIDA onlyIDA totalIndiaIndonesiaIran, Islamic Rep.IraqIsraelItalyJamaicaJapanJordanKazakhstanKenyaKiribatiKorea, Rep.KuwaitKyrgyz RepublicLao PDRLate-demographic dividendLatin America & Caribbean Latin America & Caribbean (excluding high income)Latin America & the Caribbean (IDA & IBRD countries)LatviaLeast developed countries: UN classificationLebanonLesothoLiberiaLibyaLiechtensteinLithuaniaLow & middle incomeLow incomeLower middle incomeLuxembourgMacao SAR, ChinaMacedonia, FYRMadagascarMalawiMalaysiaMaldivesMaliMaltaMarshall IslandsMauritaniaMauritiusMexicoMiddle East & North AfricaMiddle East & North Africa (excluding high income)Middle East & North Africa (IDA & IBRD countries)Middle incomeMoldovaMongoliaMontenegroMoroccoMozambiqueMyanmarNamibiaNepalNetherlandsNicaraguaNigerNigeriaNorth AmericaNorwayOECD membersOmanOther small statesPacific island small statesPakistanPanamaPapua New GuineaParaguayPeruPhilippinesPolandPortugalPost-demographic dividendPre-demographic dividendQatarRomaniaRussian FederationRwandaSamoaSan MarinoSao Tome and PrincipeSaudi ArabiaSenegalSerbiaSeychellesSierra LeoneSingaporeSlovak RepublicSloveniaSmall statesSolomon IslandsSouth AfricaSouth AsiaSouth Asia (IDA & IBRD)SpainSri LankaSt. Kitts and NevisSt. LuciaSt. Vincent and the GrenadinesSub-Saharan Africa Sub-Saharan Africa (excluding high income)Sub-Saharan Africa (IDA & IBRD countries)SudanSurinameSwazilandSwedenSwitzerlandSyrian Arab RepublicTajikistanTanzaniaThailandTimor-LesteTogoTongaTrinidad and TobagoTunisiaTurkeyUgandaUkraineUnited Arab EmiratesUpper middle incomeUruguayUzbekistanVanuatuVenezuela, RBVietnamWest Bank and GazaWorldYemen, Rep.ZambiaZimbabwe Linha do tempo:
Nesta escala de tempo está apresentado um gráfico de 1971 ano até 2014 ano World. Dados de 1970 ano ausente. O número de observações reais por data: 44.
Fonte (nome):
Indicadores de desenvolvimento mundial
Fonte (organização):
UNESCO Institute for Statistics
Categorias:
Education, Gender
Foi atualizado:
23 abr 2017 ano
Indicadores de alterações dos valores ao longo dos anos
Mínimo:
65.324
1 jan 1980 ano
Máximo:
78.079
1 jan 2002 ano
Na data de observação
Valor
Mudança absoluta
A alteração em relação ao valor anterior
1 jan 1971 ano
67.024
+67.024
0.0%
1 jan 1972 ano
66.192
-0.832
-1.24%
1 jan 1973 ano
65.636
-0.556
-0.84%
1 jan 1974 ano
65.817
+0.181
0.28%
1 jan 1975 ano
65.497
-0.321
-0.49%
1 jan 1976 ano
65.557
+0.061
0.09%
1 jan 1977 ano
65.457
-0.1
-0.15%
1 jan 1978 ano
66.006
+0.549
0.84%
1 jan 1979 ano
65.477
-0.529
-0.8%
1 jan 1980 ano
65.324
-0.153
-0.23%
1 jan 1981 ano
65.69
+0.366
0.56%
1 jan 1982 ano
65.636
-0.054
-0.08%
1 jan 1983 ano
65.579
-0.057
-0.09%
1 jan 1984 ano
65.903
+0.324
0.49%
1 jan 1985 ano
66.582
+0.679
1.03%
1 jan 1986 ano
67.252
+0.67
1.01%
1 jan 1987 ano
68.549
+1.297
1.93%
1 jan 1988 ano
68.7
+0.152
0.22%
1 jan 1989 ano
68.892
+0.191
0.28%
1 jan 1990 ano
69.371
+0.479
0.7%
1 jan 1991 ano
69.073
-0.298
-0.43%
1 jan 1992 ano
69.873
+0.8
1.16%
1 jan 1993 ano
70.139
+0.266
0.38%
1 jan 1994 ano
71.046
+0.907
1.29%
1 jan 1995 ano
70.881
-0.165
-0.23%
1 jan 1996 ano
69.932
-0.948
-1.34%
1 jan 1997 ano
70.321
+0.388
0.56%
1 jan 1998 ano
72.043
+1.722
2.45%
1 jan 1999 ano
74.202
+2.159
3.0%
1 jan 2000 ano
75.213
+1.011
1.36%
1 jan 2001 ano
75.793
+0.579
0.77%
1 jan 2002 ano
78.079
+2.286
3.02%
1 jan 2003 ano
76.385
-1.694
-2.17%
1 jan 2004 ano
75.191
-1.194
-1.56%
1 jan 2005 ano
74.568
-0.623
-0.83%
1 jan 2006 ano
74.156
-0.412
-0.55%
1 jan 2007 ano
74.22
+0.064
0.09%
1 jan 2008 ano
74.374
+0.154
0.21%
1 jan 2009 ano
75.834
+1.459
1.96%
1 jan 2010 ano
75.736
-0.098
-0.13%
1 jan 2011 ano
75.348
-0.387
-0.51%
1 jan 2012 ano
75.256
-0.093
-0.12%
1 jan 2013 ano
73.902
-1.353
-1.8%
1 jan 2014 ano
73.502
-0.4
-0.54%
Classificação de países por estatísticas atuais por anos


Comentários: