29
/pt/
pt
AIzaSyAYiBZKx7MnpbEhh9jyipgxe19OcubqV5w
April 1, 2024
95554
Burkina Faso
BFA
true
2
1
Short-term debt (% of total reserves)
2016,2015,2014,2013,2012,2011,2010,2009,2008,2007,2006,2005,2004,2003,2002,2001,2000,1999,1998,1997,1996,1995,1994,1993,1992,1991,1990,1989,1988,1987,1986,1985,1984,1983,1982,1981,1980,1979,1978
Download
Biblioteca de estatísticas globais →Burkina Faso →

Short-term debt (% of total reserves)

Estas estatísticas em outros países:
AfghanistanAlbaniaAlgeriaAngolaArgentinaArmeniaAzerbaijanBangladeshBelarusBelizeBeninBhutanBoliviaBosnia and HerzegovinaBotswanaBrazilBulgariaBurkina FasoBurundiCabo VerdeCambodiaCameroonCentral African RepublicCentral Europe and the BalticsChadChinaColombiaComorosCongo, Dem. Rep.Congo, Rep.Costa RicaCote d'IvoireDjiboutiDominicaDominican RepublicEarly-demographic dividendEast Asia & Pacific (excluding high income)East Asia & Pacific (IDA & IBRD countries)EcuadorEgypt, Arab Rep.El SalvadorEritreaEthiopiaEurope & Central Asia (excluding high income)Europe & Central Asia (IDA & IBRD countries)FijiFragile and conflict affected situationsGabonGambia, TheGeorgiaGhanaGrenadaGuatemalaGuineaGuinea-BissauGuyanaHaitiHeavily indebted poor countries (HIPC)HondurasIBRD onlyIDA & IBRD totalIDA blendIDA onlyIDA totalIndiaIndonesiaIran, Islamic Rep.JamaicaJordanKazakhstanKenyaKosovoKyrgyz RepublicLao PDRLate-demographic dividendLatin America & Caribbean Latin America & Caribbean (excluding high income)Latin America & the Caribbean (IDA & IBRD countries)Least developed countries: UN classificationLebanonLesothoLiberiaLow & middle incomeLow incomeLower middle incomeMacedonia, FYRMadagascarMalawiMalaysiaMaldivesMaliMauritaniaMauritiusMexicoMiddle East & North Africa (excluding high income)Middle East & North Africa (IDA & IBRD countries)Middle incomeMoldovaMongoliaMontenegroMoroccoMozambiqueMyanmarNepalNicaraguaNigerNigeriaPacific island small statesPakistanPanamaPapua New GuineaParaguayPeruPhilippinesPre-demographic dividendRomaniaRussian FederationRwandaSamoaSao Tome and PrincipeSenegalSerbiaSierra LeoneSolomon IslandsSouth AfricaSouth AsiaSouth Asia (IDA & IBRD)Sri LankaSt. LuciaSt. Vincent and the GrenadinesSub-Saharan Africa Sub-Saharan Africa (excluding high income)Sub-Saharan Africa (IDA & IBRD countries)SudanSwazilandSyrian Arab RepublicTajikistanTanzaniaThailandTogoTongaTunisiaTurkeyUgandaUkraineUpper middle incomeVanuatuVenezuela, RBVietnamYemen, Rep.ZambiaZimbabwe
Linha do tempo:
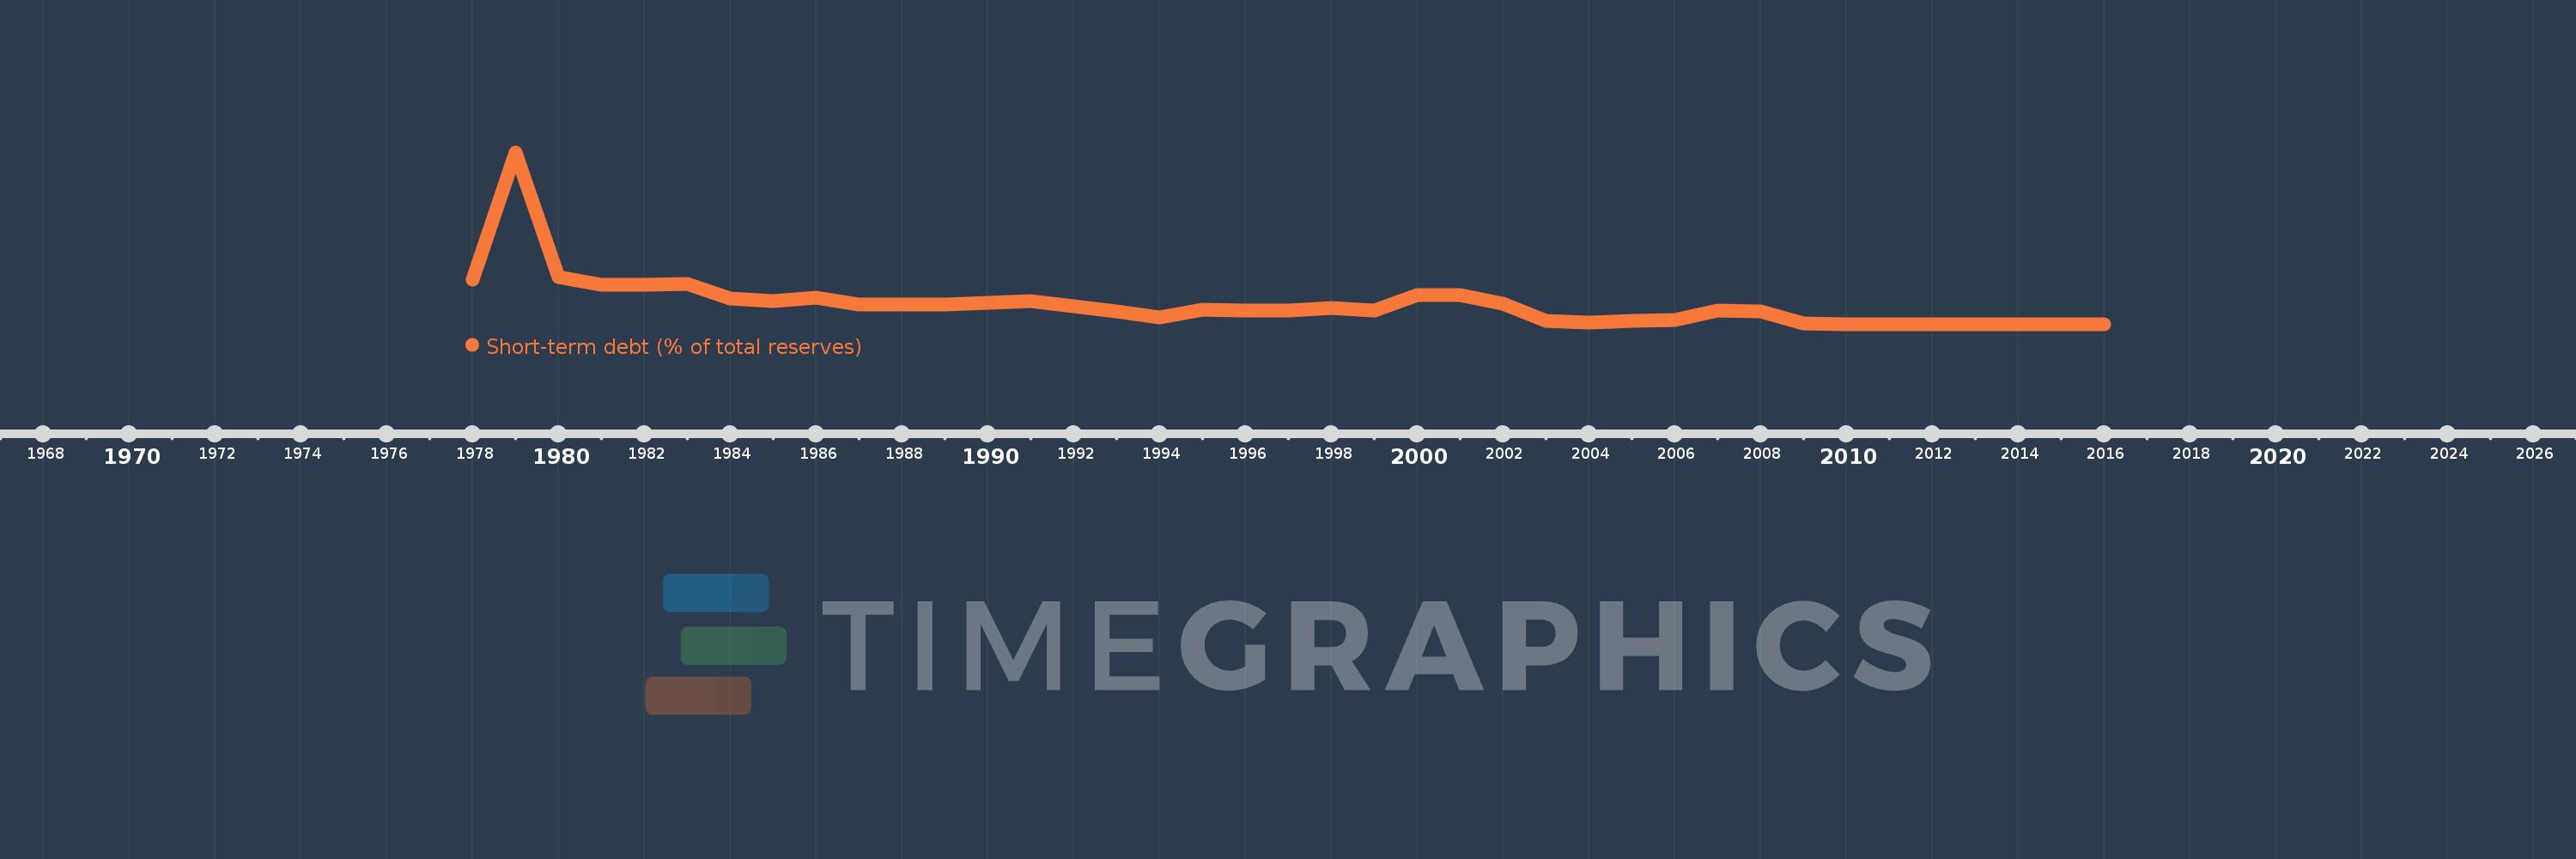
Nesta escala de tempo está apresentado um gráfico de 1978 ano até 2016 ano Burkina Faso. Dados de 1977 ano ausente. O número de observações reais por data: 39.
Fonte (nome):
Indicadores de desenvolvimento mundial
Fonte (organização):
World Bank, International Debt Statistics.
Categorias:
Economy & Growth, External Debt
Foi atualizado:
23 abr 2017 ano
Indicadores de alterações dos valores ao longo dos anos
Em média:
23.978
Mínimo:
0.0
1 jan 2010 ano
Máximo:
204.131
1 jan 1979 ano
Na data de observação
Valor
Mudança absoluta
A alteração em relação ao valor anterior
1 jan 1978 ano
52.502
+52.502
0.0%
1 jan 1979 ano
204.131
+151.629
288.81%
1 jan 1980 ano
56.451
-147.68
-72.35%
1 jan 1981 ano
46.796
-9.655
-17.1%
1 jan 1982 ano
46.486
-0.31
-0.66%
1 jan 1983 ano
47.896
+1.41
3.03%
1 jan 1984 ano
30.824
-17.072
-35.64%
1 jan 1985 ano
27.315
-3.509
-11.38%
1 jan 1986 ano
31.264
+3.949
14.46%
1 jan 1987 ano
23.018
-8.246
-26.38%
1 jan 1988 ano
23.609
+0.59
2.56%
1 jan 1989 ano
23.147
-0.461
-1.95%
1 jan 1990 ano
25.385
+2.238
9.67%
1 jan 1991 ano
27.576
+2.191
8.63%
1 jan 1992 ano
21.648
-5.927
-21.49%
1 jan 1993 ano
15.146
-6.503
-30.04%
1 jan 1994 ano
7.728
-7.418
-48.98%
1 jan 1995 ano
16.888
+9.16
118.52%
1 jan 1996 ano
16.073
-0.814
-4.82%
1 jan 1997 ano
15.76
-0.313
-1.95%
1 jan 1998 ano
19.095
+3.335
21.16%
1 jan 1999 ano
15.917
-3.178
-16.64%
1 jan 2000 ano
35.051
+19.134
120.21%
1 jan 2001 ano
34.749
-0.302
-0.86%
1 jan 2002 ano
24.35
-10.399
-29.93%
1 jan 2003 ano
3.706
-20.643
-84.78%
1 jan 2004 ano
1.88
-1.827
-49.29%
1 jan 2005 ano
3.652
+1.772
94.29%
1 jan 2006 ano
5.069
+1.417
38.8%
1 jan 2007 ano
16.052
+10.982
216.64%
1 jan 2008 ano
15.062
-0.989
-6.16%
1 jan 2009 ano
0.92
-14.142
-93.89%
1 jan 2010 ano
0.0
-0.92
-100.0%
1 jan 2011 ano
0.0
0.0
%
1 jan 2012 ano
0.0
0.0
%
1 jan 2013 ano
0.0
0.0
%
1 jan 2014 ano
0.0
0.0
%
1 jan 2015 ano
0.0
0.0
%
1 jan 2016 ano
0.0
0.0
%
Classificação de países por estatísticas atuais por anos

Comentários:

Enviar
PremiumAbout & FeedbackAcordoPrivacidade
logo
© 2022 Selected Technologies LLC – Morgan Hill, California