29
/pt/
pt
AIzaSyAYiBZKx7MnpbEhh9jyipgxe19OcubqV5w
April 1, 2024
35388
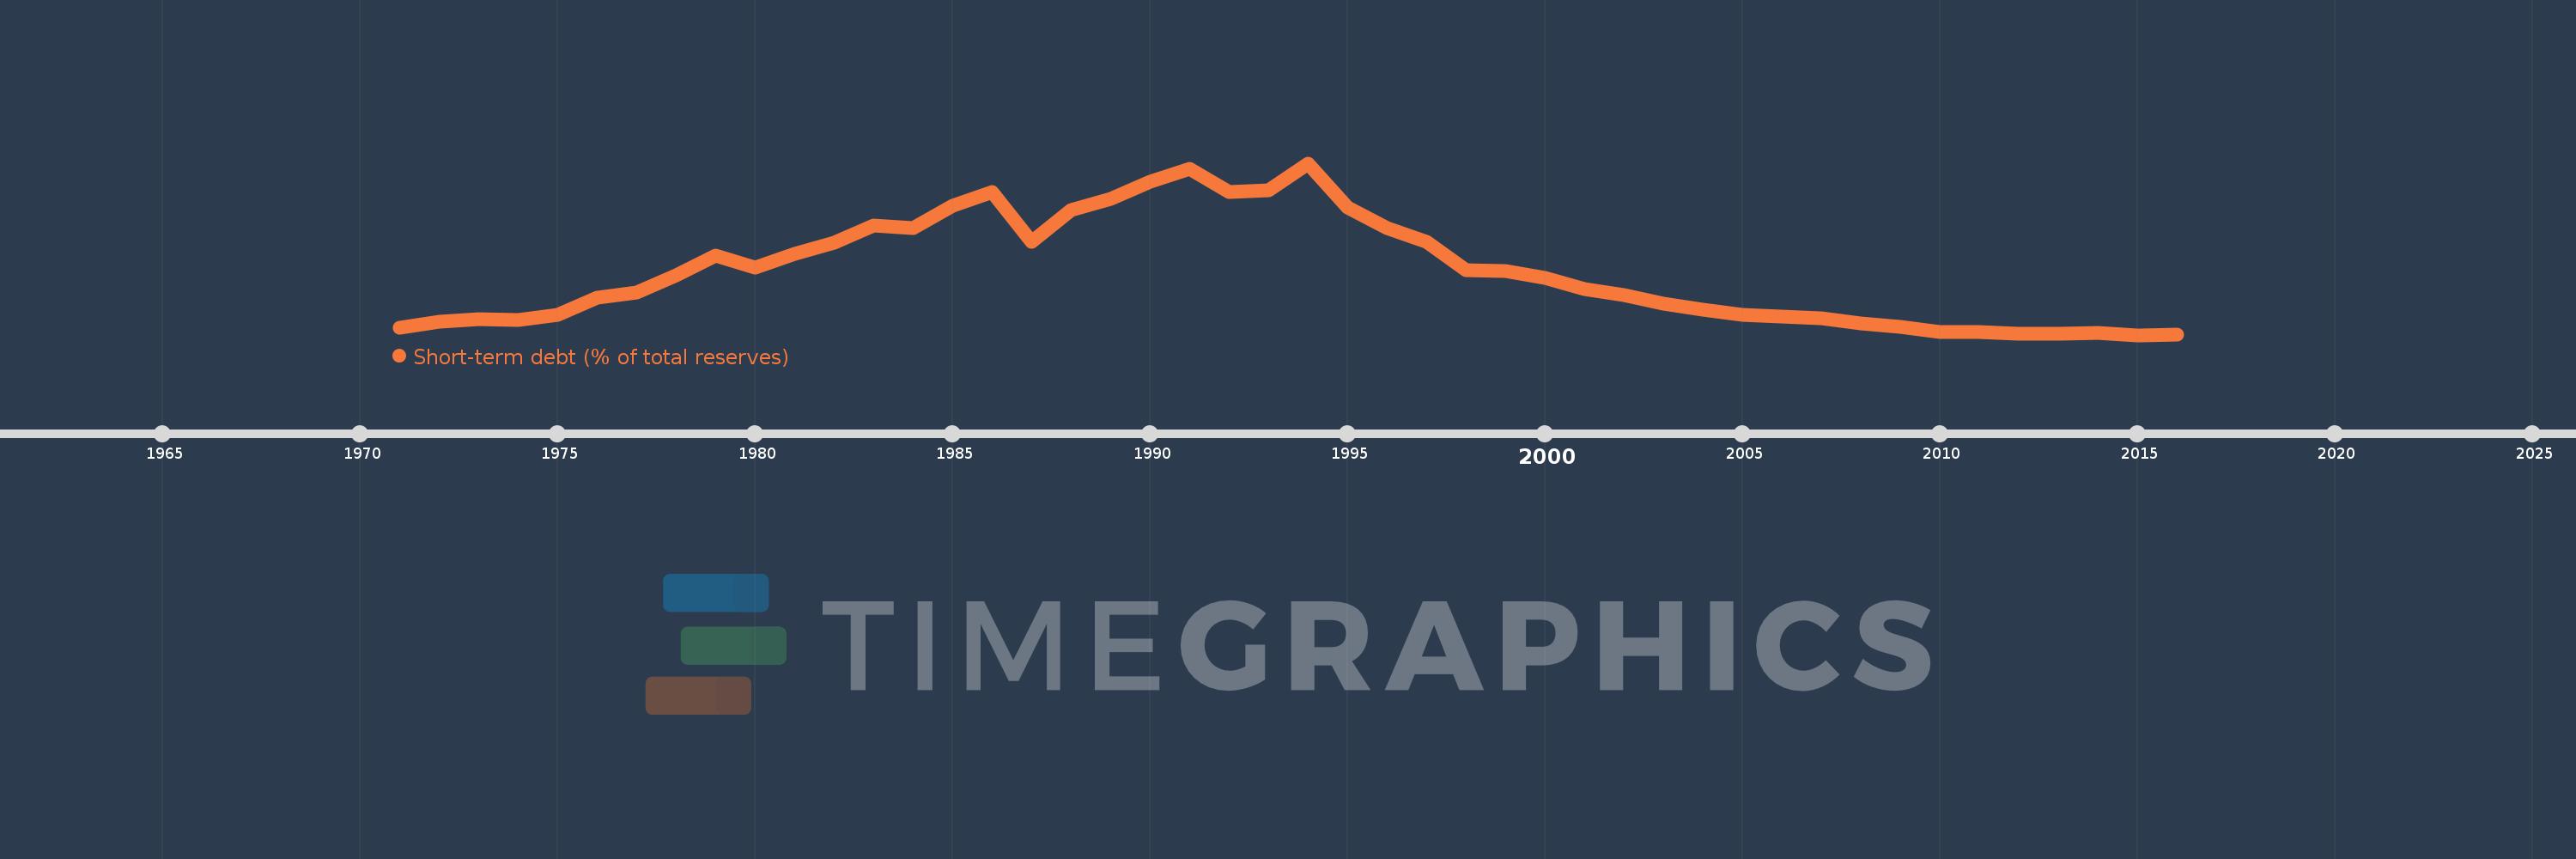
Heavily indebted poor countries (HIPC)
HPC
false
2
1
Short-term debt (% of total reserves)
2016,2015,2014,2013,2012,2011,2010,2009,2008,2007,2006,2005,2004,2003,2002,2001,2000,1999,1998,1997,1996,1995,1994,1993,1992,1991,1990,1989,1988,1987,1986,1985,1984,1983,1982,1981,1980,1979,1978,1977,1976,1975,1974,1973,1972,1971
Estas estatísticas em outros países:
Linha do tempo:
Nesta escala de tempo está apresentado um gráfico de 1971 ano até 2016 ano Heavily indebted poor countries (HIPC). Dados de 1970 ano ausente. O número de observações reais por data: 46.
Fonte (nome):
Indicadores de desenvolvimento mundial
Fonte (organização):
World Bank, International Debt Statistics.
Categorias:
Economy & Growth, External Debt
Foi atualizado:
23 abr 2017 ano
Indicadores de alterações dos valores ao longo dos anos
Mínimo:
19.602
1 jan 2015 ano
Máximo:
444.9
1 jan 1994 ano
Na data de observação
Valor
Mudança absoluta
A alteração em relação ao valor anterior
1 jan 1971 ano
38.329
+38.329
0.0%
1 jan 1972 ano
52.202
+13.874
36.2%
1 jan 1973 ano
59.093
+6.891
13.2%
1 jan 1974 ano
57.226
-1.867
-3.16%
1 jan 1975 ano
69.719
+12.493
21.83%
1 jan 1976 ano
111.337
+41.617
59.69%
1 jan 1977 ano
124.816
+13.479
12.11%
1 jan 1978 ano
168.432
+43.616
34.94%
1 jan 1979 ano
215.565
+47.134
27.98%
1 jan 1980 ano
186.825
-28.741
-13.33%
1 jan 1981 ano
219.521
+32.696
17.5%
1 jan 1982 ano
249.182
+29.661
13.51%
1 jan 1983 ano
290.721
+41.539
16.67%
1 jan 1984 ano
284.282
-6.438
-2.21%
1 jan 1985 ano
338.784
+54.502
19.17%
1 jan 1986 ano
374.386
+35.602
10.51%
1 jan 1987 ano
251.113
-123.273
-32.93%
1 jan 1988 ano
329.922
+78.809
31.38%
1 jan 1989 ano
356.661
+26.739
8.1%
1 jan 1990 ano
399.815
+43.155
12.1%
1 jan 1991 ano
430.886
+31.071
7.77%
1 jan 1992 ano
373.787
-57.099
-13.25%
1 jan 1993 ano
378.297
+4.51
1.21%
1 jan 1994 ano
444.9
+66.603
17.61%
1 jan 1995 ano
335.593
-109.307
-24.57%
1 jan 1996 ano
284.237
-51.356
-15.3%
1 jan 1997 ano
251.147
-33.09
-11.64%
1 jan 1998 ano
181.146
-70.001
-27.87%
1 jan 1999 ano
177.006
-4.141
-2.29%
1 jan 2000 ano
160.968
-16.038
-9.06%
1 jan 2001 ano
133.387
-27.581
-17.13%
1 jan 2002 ano
117.899
-15.487
-11.61%
1 jan 2003 ano
98.203
-19.697
-16.71%
1 jan 2004 ano
81.833
-16.369
-16.67%
1 jan 2005 ano
70.373
-11.46
-14.0%
1 jan 2006 ano
65.672
-4.701
-6.68%
1 jan 2007 ano
60.553
-5.12
-7.8%
1 jan 2008 ano
49.087
-11.466
-18.94%
1 jan 2009 ano
38.943
-10.143
-20.66%
1 jan 2010 ano
27.505
-11.438
-29.37%
1 jan 2011 ano
27.431
-0.074
-0.27%
1 jan 2012 ano
23.545
-3.886
-14.17%
1 jan 2013 ano
23.783
+0.238
1.01%
1 jan 2014 ano
24.622
+0.838
3.53%
1 jan 2015 ano
19.602
-5.019
-20.39%
1 jan 2016 ano
21.421
+1.818
9.28%
Classificação de países por estatísticas atuais por anos


Comentários: