29
/pt/
pt
AIzaSyAYiBZKx7MnpbEhh9jyipgxe19OcubqV5w
April 1, 2024
148615
Guyana
GUY
true
2
1
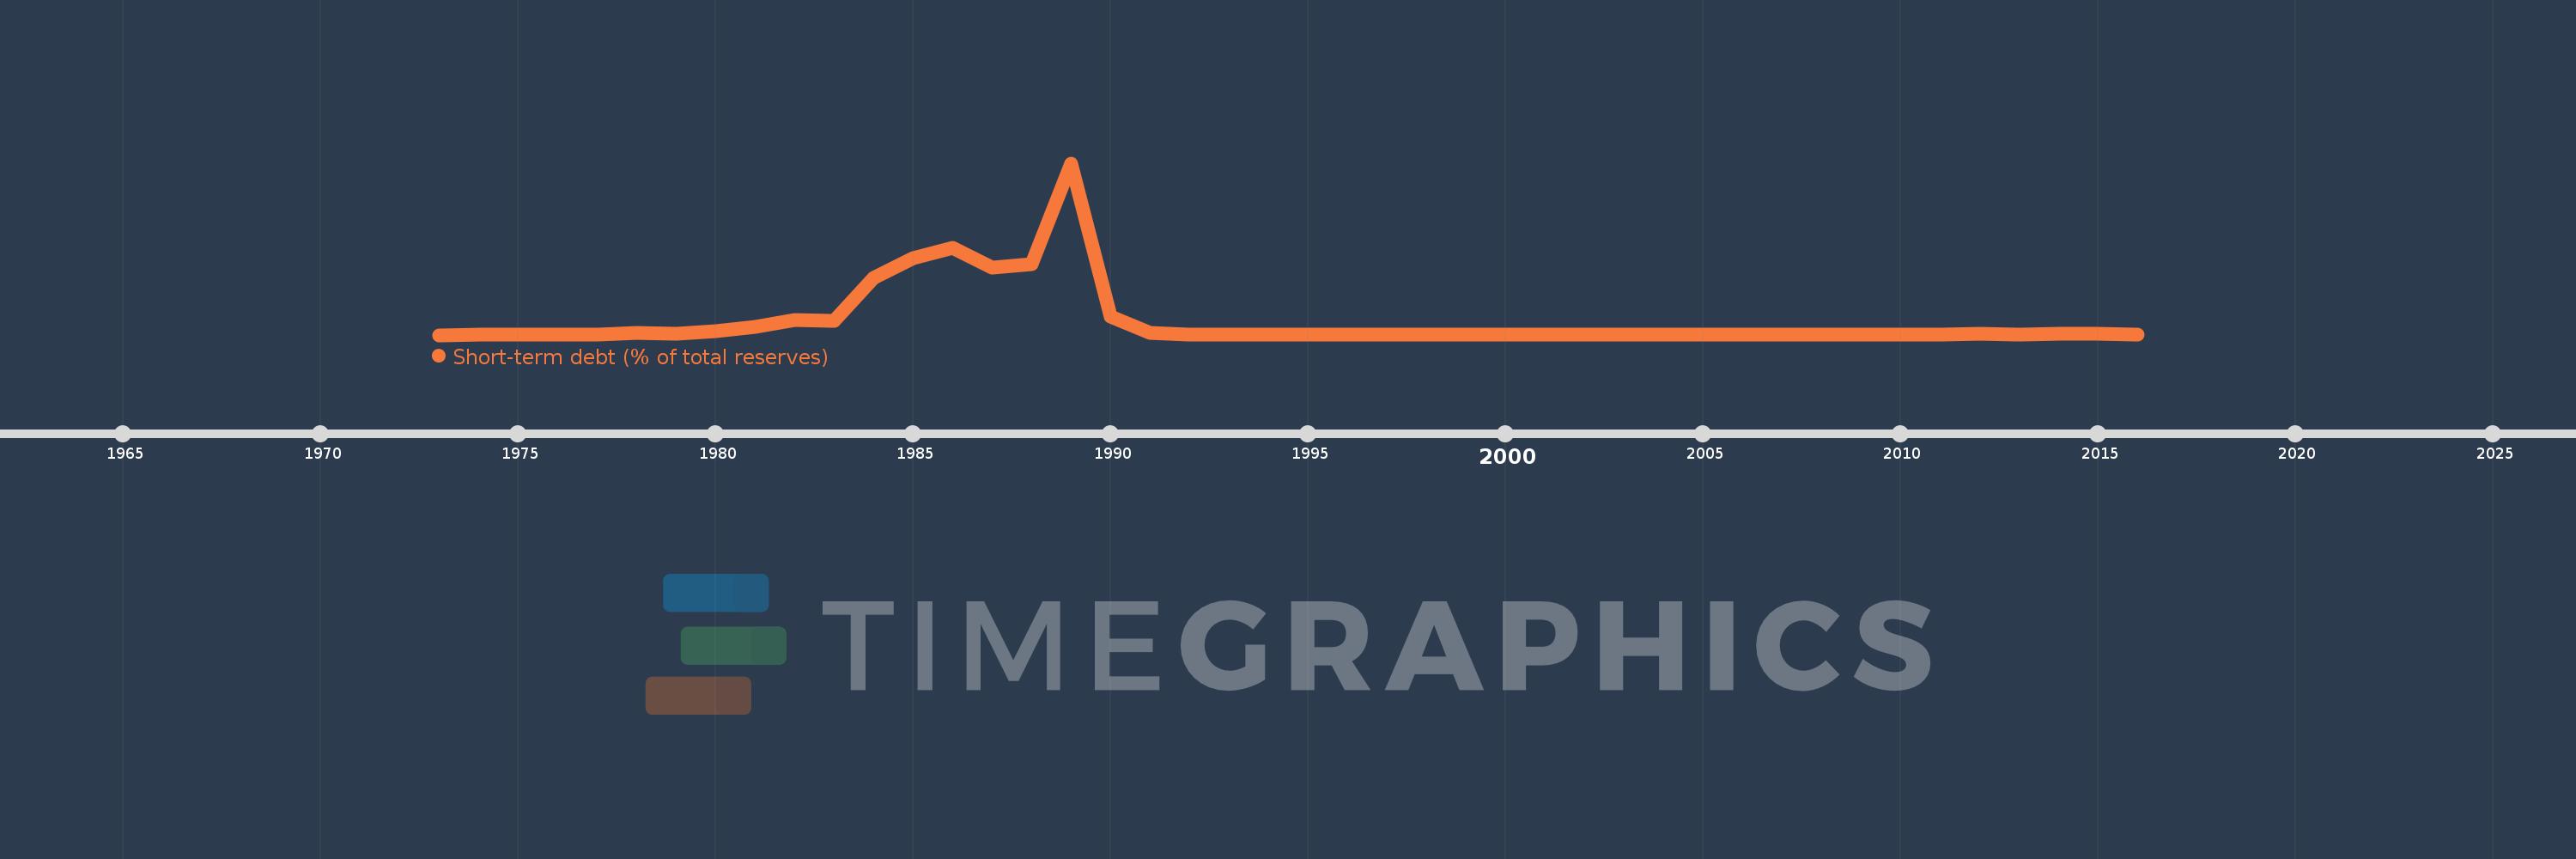
Short-term debt (% of total reserves)
2016,2015,2014,2013,2012,2011,2010,2009,2008,2007,2006,2005,2004,2003,2002,2001,2000,1999,1998,1997,1996,1995,1994,1993,1992,1991,1990,1989,1988,1987,1986,1985,1984,1983,1982,1981,1980,1979,1978,1977,1976,1975,1974,1973
Estas estatísticas em outros países:
Linha do tempo:
Nesta escala de tempo está apresentado um gráfico de 1973 ano até 2016 ano Guyana. Dados de 1972 ano ausente. O número de observações reais por data: 44.
Fonte (nome):
Indicadores de desenvolvimento mundial
Fonte (organização):
World Bank, International Debt Statistics.
Categorias:
Economy & Growth, External Debt
Foi atualizado:
23 abr 2017 ano
Indicadores de alterações dos valores ao longo dos anos
Mínimo:
1.464
1 jan 1973 ano
Máximo:
18.85 mil
1 jan 1989 ano
Na data de observação
Valor
Mudança absoluta
A alteração em relação ao valor anterior
1 jan 1973 ano
1.464
+1.464
0.0%
1 jan 1974 ano
2.333
+0.869
59.36%
1 jan 1975 ano
1.654
-0.679
-29.1%
1 jan 1976 ano
1.623
-0.031
-1.88%
1 jan 1977 ano
4.409
+2.786
171.69%
1 jan 1978 ano
206.601
+202.192
4.59 mil%
1 jan 1979 ano
134.995
-71.606
-34.66%
1 jan 1980 ano
418.963
+283.968
210.35%
1 jan 1981 ano
928.945
+509.982
121.72%
1 jan 1982 ano
1.635 mil
+706.084
76.01%
1 jan 1983 ano
1.587 mil
-47.835
-2.93%
1 jan 1984 ano
6.247 mil
+4.66 mil
293.58%
1 jan 1985 ano
8.436 mil
+2.189 mil
35.04%
1 jan 1986 ano
9.561 mil
+1.126 mil
13.34%
1 jan 1987 ano
7.397 mil
-2.164 mil
-22.64%
1 jan 1988 ano
7.758 mil
+361.449
4.89%
1 jan 1989 ano
18.85 mil
+11.091 mil
142.95%
1 jan 1990 ano
1.99 mil
-16.859 mil
-89.44%
1 jan 1991 ano
260.379
-1.73 mil
-86.92%
1 jan 1992 ano
40.132
-220.246
-84.59%
1 jan 1993 ano
28.963
-11.169
-27.83%
1 jan 1994 ano
18.215
-10.749
-37.11%
1 jan 1995 ano
28.863
+10.648
58.46%
1 jan 1996 ano
55.723
+26.86
93.06%
1 jan 1997 ano
25.813
-29.91
-53.68%
1 jan 1998 ano
32.427
+6.614
25.62%
1 jan 1999 ano
45.801
+13.374
41.24%
1 jan 2000 ano
51.507
+5.705
12.46%
1 jan 2001 ano
35.886
-15.62
-30.33%
1 jan 2002 ano
39.123
+3.236
9.02%
1 jan 2003 ano
44.341
+5.218
13.34%
1 jan 2004 ano
42.619
-1.722
-3.88%
1 jan 2005 ano
49.246
+6.627
15.55%
1 jan 2006 ano
33.352
-15.895
-32.28%
1 jan 2007 ano
57.985
+24.633
73.86%
1 jan 2008 ano
58.496
+0.511
0.88%
1 jan 2009 ano
66.248
+7.752
13.25%
1 jan 2010 ano
71.584
+5.335
8.05%
1 jan 2011 ano
42.62
-28.963
-40.46%
1 jan 2012 ano
96.038
+53.417
125.33%
1 jan 2013 ano
68.039
-27.998
-29.15%
1 jan 2014 ano
130.893
+62.853
92.38%
1 jan 2015 ano
137.596
+6.703
5.12%
1 jan 2016 ano
58.884
-78.711
-57.2%
Classificação de países por estatísticas atuais por anos


Comentários: