29
/pt/
pt
AIzaSyAYiBZKx7MnpbEhh9jyipgxe19OcubqV5w
April 1, 2024
163290
Jamaica
JAM
true
2
1
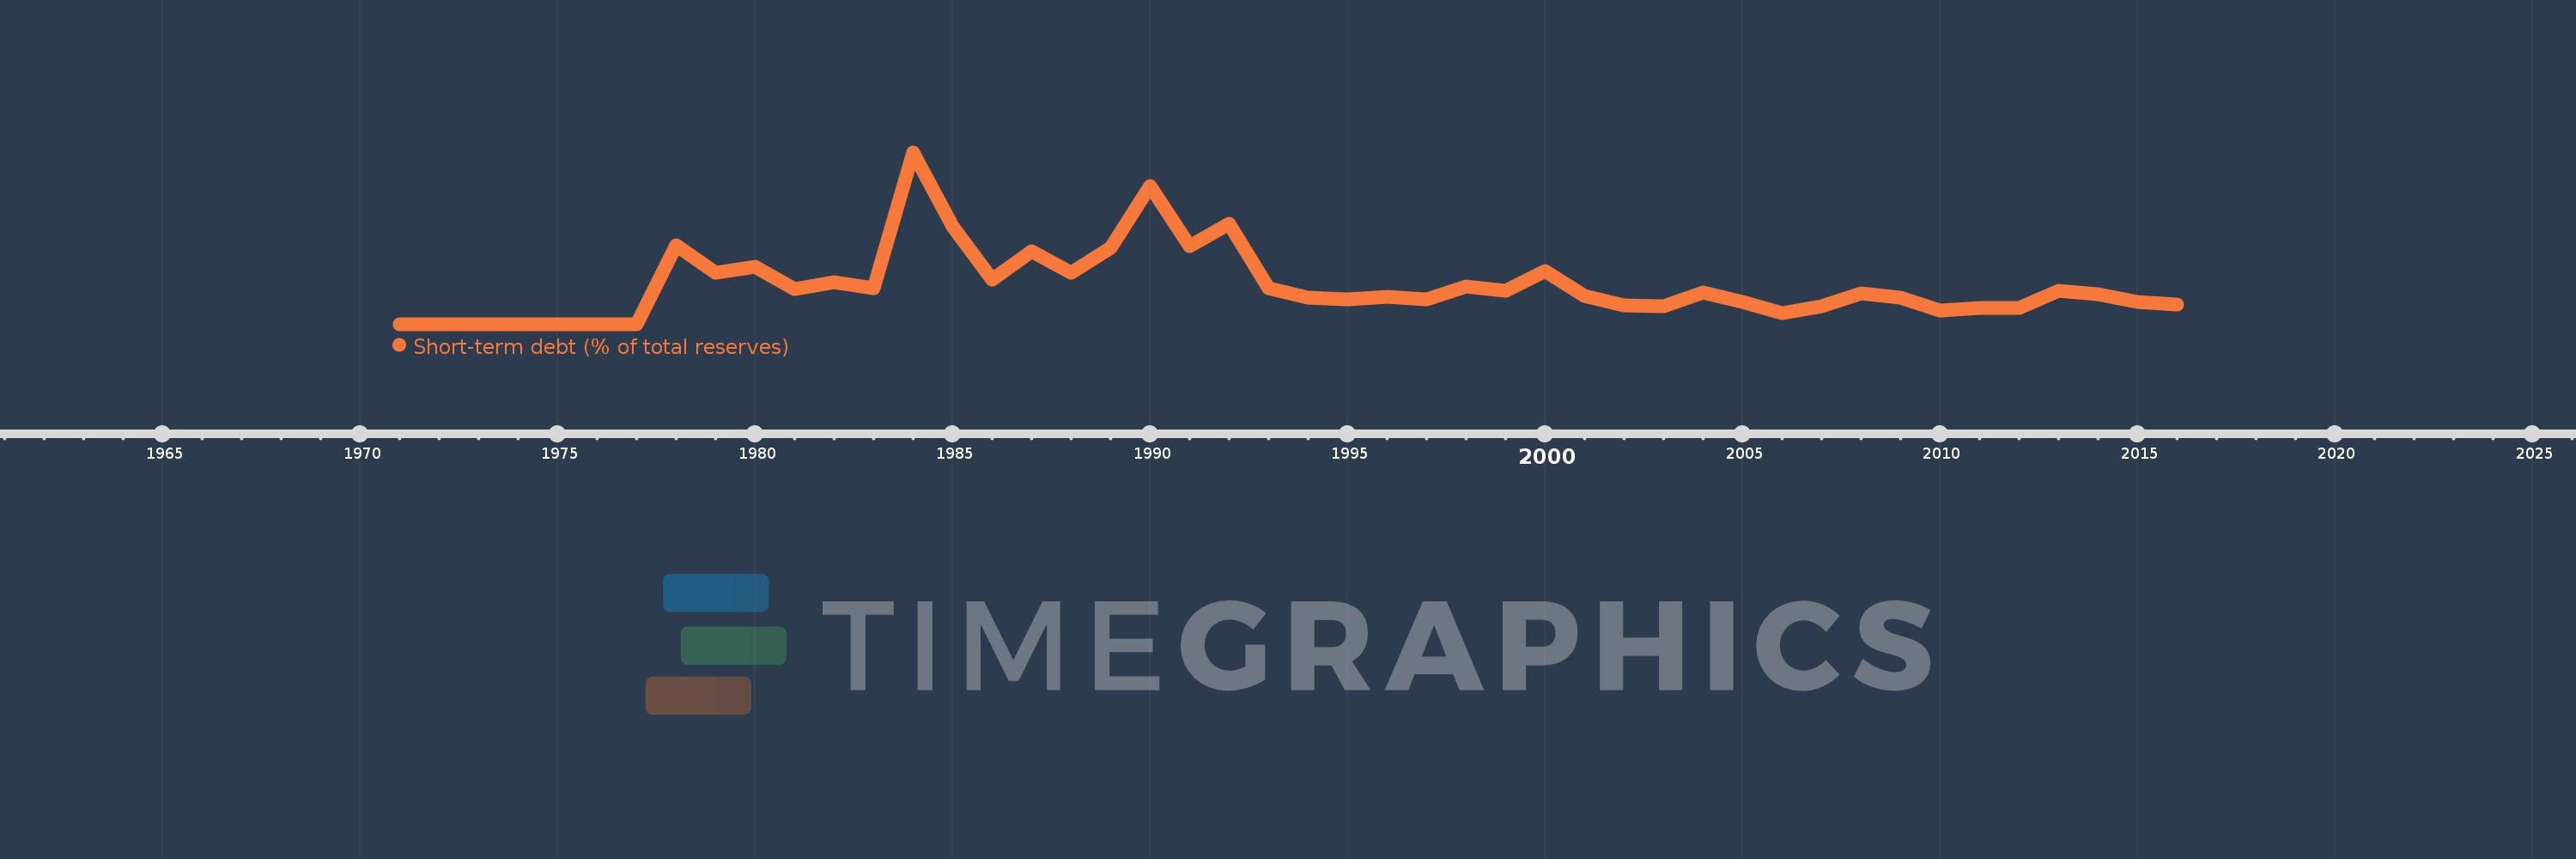
Short-term debt (% of total reserves)
2016,2015,2014,2013,2012,2011,2010,2009,2008,2007,2006,2005,2004,2003,2002,2001,2000,1999,1998,1997,1996,1995,1994,1993,1992,1991,1990,1989,1988,1987,1986,1985,1984,1983,1982,1981,1980,1979,1978,1977,1976,1975,1974,1973,1972,1971
Estas estatísticas em outros países:
Linha do tempo:
Nesta escala de tempo está apresentado um gráfico de 1971 ano até 2016 ano Jamaica. Dados de 1970 ano ausente. O número de observações reais por data: 46.
Fonte (nome):
Indicadores de desenvolvimento mundial
Fonte (organização):
World Bank, International Debt Statistics.
Categorias:
Economy & Growth, External Debt
Foi atualizado:
23 abr 2017 ano
Indicadores de alterações dos valores ao longo dos anos
Máximo:
453.559
1 jan 1984 ano
Na data de observação
Valor
Mudança absoluta
A alteração em relação ao valor anterior
1 jan 1971 ano
0.005
+0.005
0.0%
1 jan 1972 ano
0.0
-0.005
-100.0%
1 jan 1974 ano
0.328
+0.328
%
1 jan 1975 ano
0.291
-0.037
-11.28%
1 jan 1976 ano
0.0
-0.291
-100.0%
1 jan 1978 ano
207.467
+207.467
%
1 jan 1979 ano
136.0
-71.467
-34.45%
1 jan 1980 ano
152.3
+16.3
11.99%
1 jan 1981 ano
93.333
-58.967
-38.72%
1 jan 1982 ano
109.838
+16.504
17.68%
1 jan 1983 ano
94.771
-15.067
-13.72%
1 jan 1984 ano
453.559
+358.788
378.58%
1 jan 1985 ano
259.406
-194.152
-42.81%
1 jan 1986 ano
117.538
-141.869
-54.69%
1 jan 1987 ano
191.572
+74.034
62.99%
1 jan 1988 ano
136.118
-55.454
-28.95%
1 jan 1989 ano
200.639
+64.521
47.4%
1 jan 1990 ano
363.904
+163.265
81.37%
1 jan 1991 ano
205.959
-157.945
-43.4%
1 jan 1992 ano
264.946
+58.987
28.64%
1 jan 1993 ano
95.89
-169.056
-63.81%
1 jan 1994 ano
69.073
-26.816
-27.97%
1 jan 1995 ano
65.584
-3.489
-5.05%
1 jan 1996 ano
72.174
+6.59
10.05%
1 jan 1997 ano
65.302
-6.872
-9.52%
1 jan 1998 ano
100.441
+35.139
53.81%
1 jan 1999 ano
88.898
-11.543
-11.49%
1 jan 2000 ano
141.424
+52.525
59.08%
1 jan 2001 ano
75.239
-66.184
-46.8%
1 jan 2002 ano
48.993
-26.246
-34.88%
1 jan 2003 ano
47.484
-1.509
-3.08%
1 jan 2004 ano
82.735
+35.251
74.24%
1 jan 2005 ano
59.456
-23.279
-28.14%
1 jan 2006 ano
28.401
-31.055
-52.23%
1 jan 2007 ano
47.387
+18.986
66.85%
1 jan 2008 ano
81.678
+34.291
72.36%
1 jan 2009 ano
71.037
-10.64
-13.03%
1 jan 2010 ano
36.067
-34.971
-49.23%
1 jan 2011 ano
43.554
+7.487
20.76%
1 jan 2012 ano
43.284
-0.27
-0.62%
1 jan 2013 ano
88.399
+45.115
104.23%
1 jan 2014 ano
79.175
-9.223
-10.43%
1 jan 2015 ano
59.391
-19.784
-24.99%
1 jan 2016 ano
51.092
-8.298
-13.97%
Classificação de países por estatísticas atuais por anos


Comentários: