29
/pt/
pt
AIzaSyAYiBZKx7MnpbEhh9jyipgxe19OcubqV5w
April 1, 2024
280414
Vanuatu
VUT
true
2
1
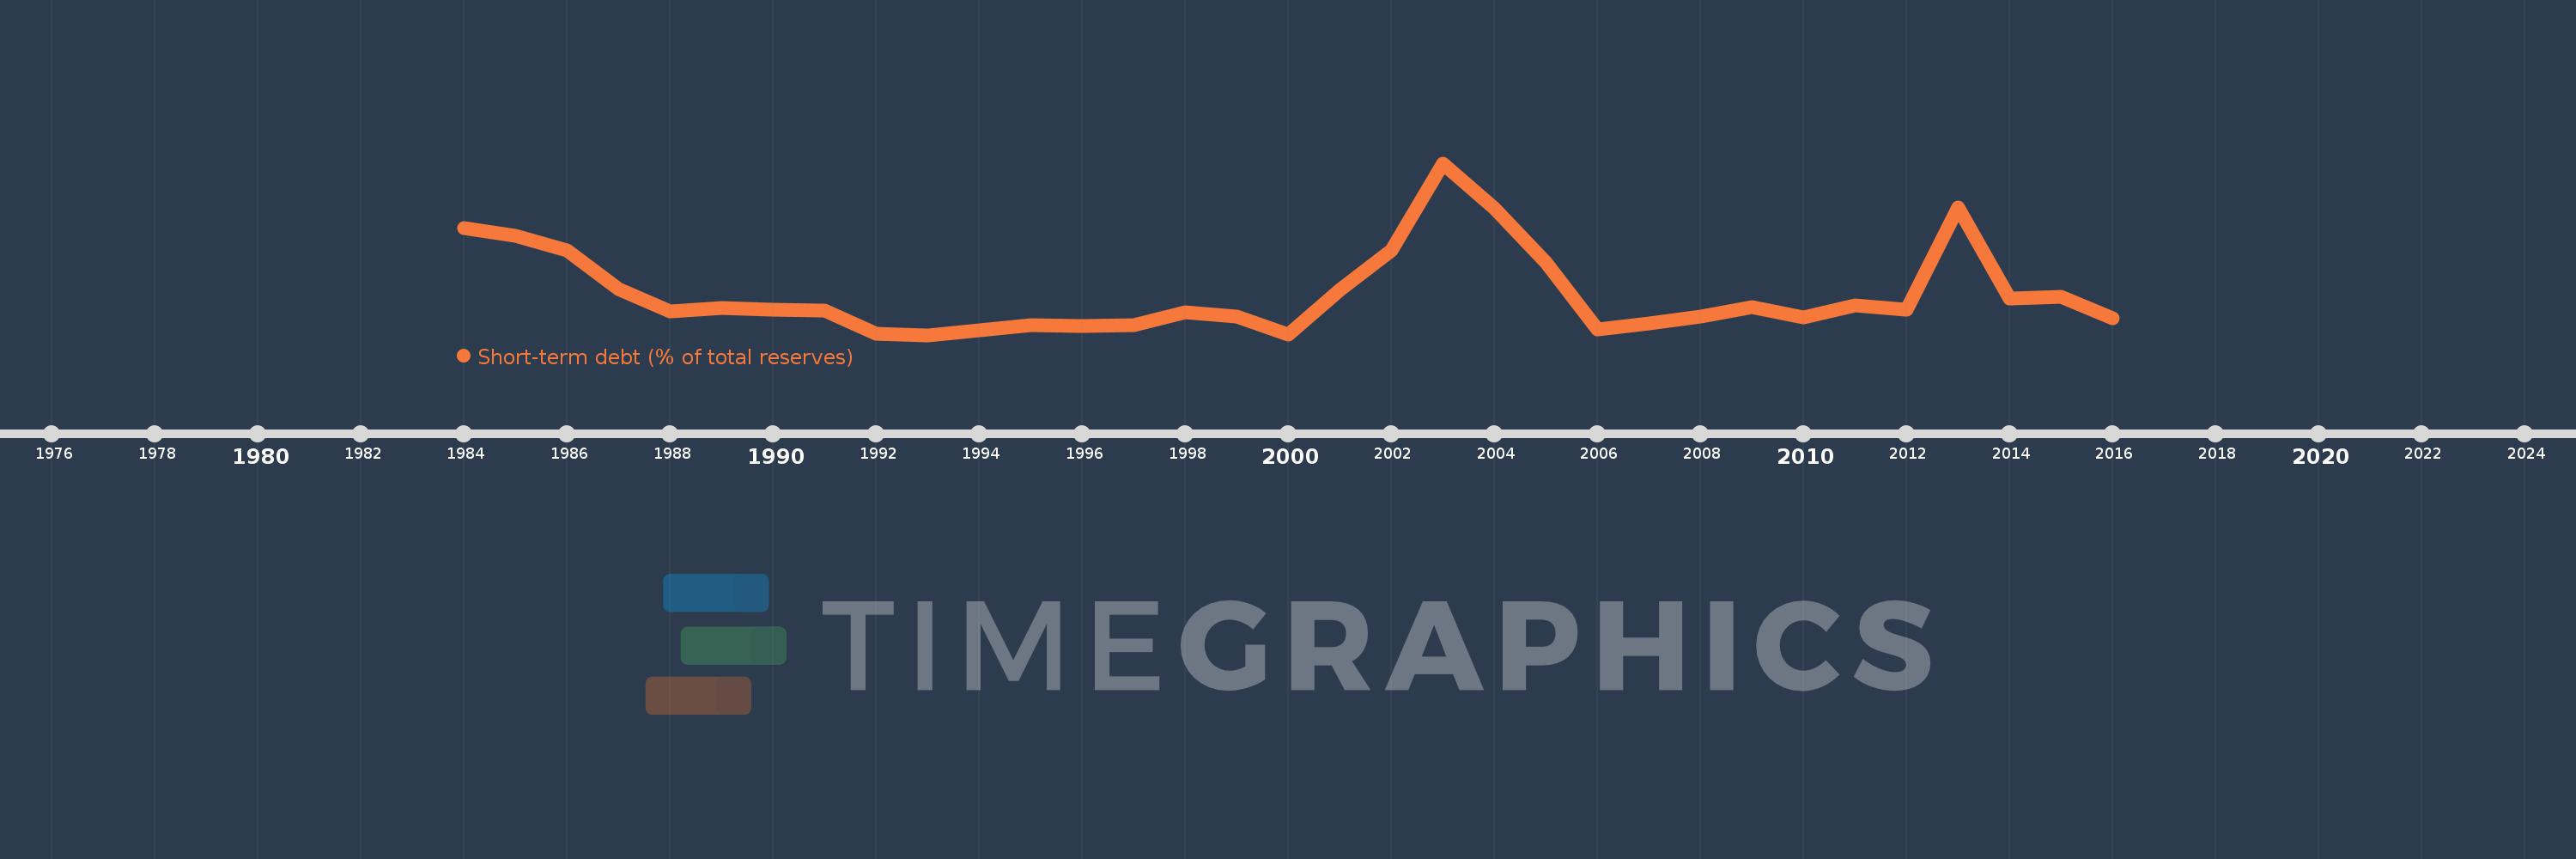
Short-term debt (% of total reserves)
2016,2015,2014,2013,2012,2011,2010,2009,2008,2007,2006,2005,2004,2003,2002,2001,2000,1999,1998,1997,1996,1995,1994,1993,1992,1991,1990,1989,1988,1987,1986,1985,1984
Estas estatísticas em outros países:
Linha do tempo:
Nesta escala de tempo está apresentado um gráfico de 1984 ano até 2016 ano Vanuatu. Dados de 1983 ano ausente. O número de observações reais por data: 33.
Fonte (nome):
Indicadores de desenvolvimento mundial
Fonte (organização):
World Bank, International Debt Statistics.
Categorias:
Economy & Growth, External Debt
Foi atualizado:
23 abr 2017 ano
Indicadores de alterações dos valores ao longo dos anos
Mínimo:
1.955
1 jan 1993 ano
Máximo:
169.761
1 jan 2003 ano
Na data de observação
Valor
Mudança absoluta
A alteração em relação ao valor anterior
1 jan 1984 ano
106.147
+106.147
0.0%
1 jan 1985 ano
98.925
-7.222
-6.8%
1 jan 1986 ano
84.824
-14.101
-14.25%
1 jan 1987 ano
46.686
-38.137
-44.96%
1 jan 1988 ano
24.891
-21.795
-46.68%
1 jan 1989 ano
28.276
+3.385
13.6%
1 jan 1990 ano
27.08
-1.196
-4.23%
1 jan 1991 ano
25.47
-1.61
-5.95%
1 jan 1992 ano
3.113
-22.357
-87.78%
1 jan 1993 ano
1.955
-1.158
-37.2%
1 jan 1994 ano
6.581
+4.626
236.65%
1 jan 1995 ano
11.474
+4.893
74.35%
1 jan 1996 ano
10.354
-1.12
-9.76%
1 jan 1997 ano
11.383
+1.029
9.94%
1 jan 1998 ano
24.126
+12.743
111.94%
1 jan 1999 ano
20.148
-3.978
-16.49%
1 jan 2000 ano
2.757
-17.391
-86.32%
1 jan 2001 ano
46.245
+43.489
1.58 mil%
1 jan 2002 ano
84.975
+38.73
83.75%
1 jan 2003 ano
169.761
+84.786
99.78%
1 jan 2004 ano
125.524
-44.237
-26.06%
1 jan 2005 ano
72.977
-52.546
-41.86%
1 jan 2006 ano
7.753
-65.224
-89.38%
1 jan 2007 ano
13.479
+5.725
73.85%
1 jan 2008 ano
20.162
+6.684
49.59%
1 jan 2009 ano
29.604
+9.442
46.83%
1 jan 2010 ano
19.514
-10.09
-34.08%
1 jan 2011 ano
30.982
+11.469
58.77%
1 jan 2012 ano
27.044
-3.938
-12.71%
1 jan 2013 ano
126.764
+99.72
368.73%
1 jan 2014 ano
37.947
-88.817
-70.07%
1 jan 2015 ano
39.131
+1.184
3.12%
1 jan 2016 ano
18.576
-20.555
-52.53%
Classificação de países por estatísticas atuais por anos


Comentários: