29
/pt/
pt
AIzaSyAYiBZKx7MnpbEhh9jyipgxe19OcubqV5w
April 1, 2024
221575
Paraguay
PRY
true
2
1
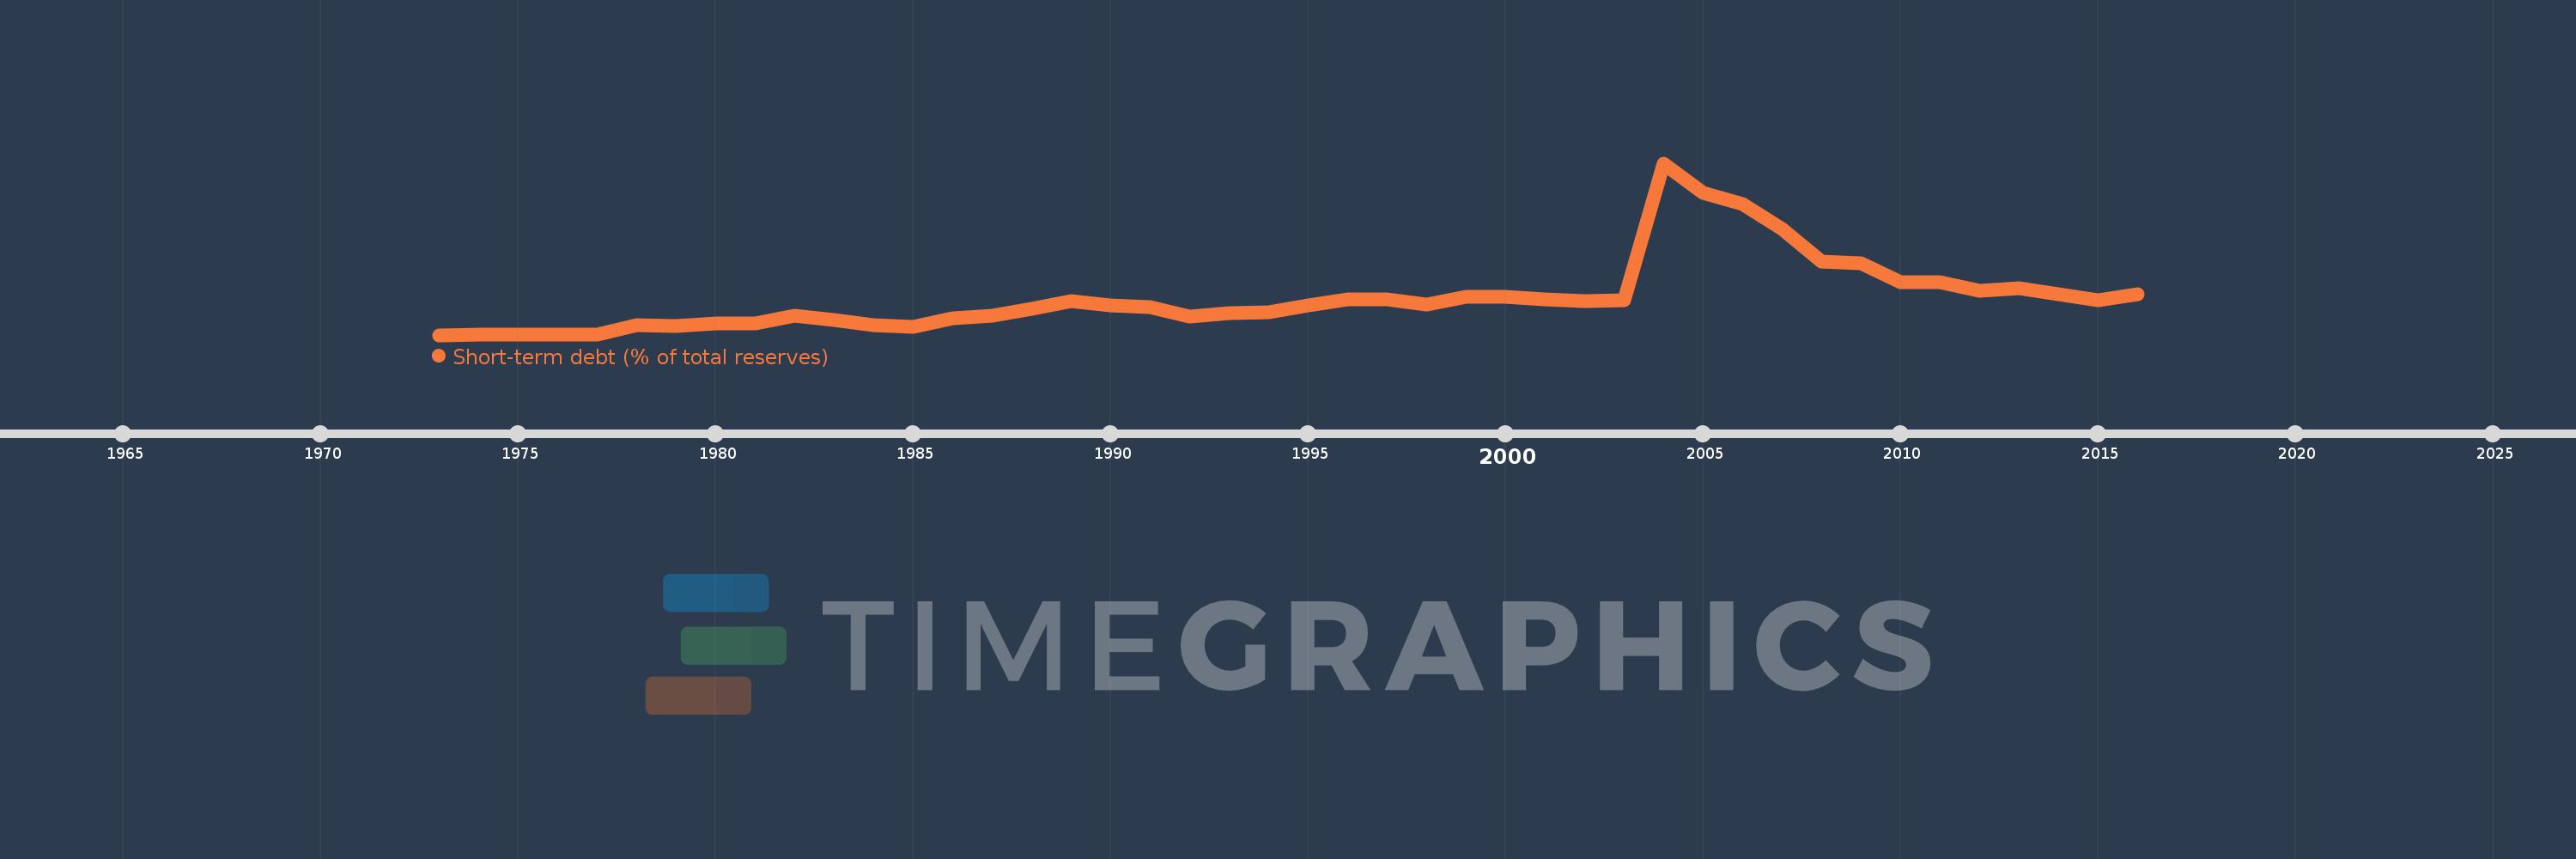
Short-term debt (% of total reserves)
2016,2015,2014,2013,2012,2011,2010,2009,2008,2007,2006,2005,2004,2003,2002,2001,2000,1999,1998,1997,1996,1995,1994,1993,1992,1991,1990,1989,1988,1987,1986,1985,1984,1983,1982,1981,1980,1979,1978,1977,1976,1975,1974,1973
Estas estatísticas em outros países:
Linha do tempo:
Nesta escala de tempo está apresentado um gráfico de 1973 ano até 2016 ano Paraguay. Dados de 1972 ano ausente. O número de observações reais por data: 44.
Fonte (nome):
Indicadores de desenvolvimento mundial
Fonte (organização):
World Bank, International Debt Statistics.
Categorias:
Economy & Growth, External Debt
Foi atualizado:
23 abr 2017 ano
Indicadores de alterações dos valores ao longo dos anos
Mínimo:
0.054
1 jan 1973 ano
Máximo:
340.653
1 jan 2004 ano
Na data de observação
Valor
Mudança absoluta
A alteração em relação ao valor anterior
1 jan 1973 ano
0.054
+0.054
0.0%
1 jan 1974 ano
0.065
+0.011
19.87%
1 jan 1975 ano
0.065
+0.0
0.74%
1 jan 1976 ano
0.07
+0.005
7.89%
1 jan 1977 ano
0.098
+0.027
38.95%
1 jan 1978 ano
20.18
+20.082
20.58 mil%
1 jan 1979 ano
18.772
-1.407
-6.97%
1 jan 1980 ano
23.208
+4.435
23.63%
1 jan 1981 ano
22.249
-0.958
-4.13%
1 jan 1982 ano
37.589
+15.34
68.94%
1 jan 1983 ano
30.254
-7.335
-19.51%
1 jan 1984 ano
20.327
-9.928
-32.81%
1 jan 1985 ano
16.526
-3.801
-18.7%
1 jan 1986 ano
32.878
+16.351
98.94%
1 jan 1987 ano
38.013
+5.136
15.62%
1 jan 1988 ano
52.171
+14.158
37.24%
1 jan 1989 ano
68.11
+15.939
30.55%
1 jan 1990 ano
58.368
-9.742
-14.3%
1 jan 1991 ano
55.288
-3.08
-5.28%
1 jan 1992 ano
37.084
-18.204
-32.93%
1 jan 1993 ano
43.284
+6.2
16.72%
1 jan 1994 ano
44.838
+1.554
3.59%
1 jan 1995 ano
58.286
+13.448
29.99%
1 jan 1996 ano
70.829
+12.543
21.52%
1 jan 1997 ano
69.879
-0.95
-1.34%
1 jan 1998 ano
60.888
-8.991
-12.87%
1 jan 1999 ano
76.403
+15.515
25.48%
1 jan 2000 ano
75.976
-0.427
-0.56%
1 jan 2001 ano
71.048
-4.928
-6.49%
1 jan 2002 ano
66.544
-4.504
-6.34%
1 jan 2003 ano
69.121
+2.577
3.87%
1 jan 2004 ano
340.653
+271.533
392.84%
1 jan 2005 ano
282.341
-58.312
-17.12%
1 jan 2006 ano
260.487
-21.854
-7.74%
1 jan 2007 ano
210.32
-50.167
-19.26%
1 jan 2008 ano
145.816
-64.503
-30.67%
1 jan 2009 ano
142.076
-3.741
-2.57%
1 jan 2010 ano
105.161
-36.915
-25.98%
1 jan 2011 ano
104.964
-0.197
-0.19%
1 jan 2012 ano
87.946
-17.017
-16.21%
1 jan 2013 ano
93.317
+5.37
6.11%
1 jan 2014 ano
80.381
-12.936
-13.86%
1 jan 2015 ano
69.297
-11.084
-13.79%
1 jan 2016 ano
80.868
+11.57
16.7%
Classificação de países por estatísticas atuais por anos


Comentários: