29
/pt/
pt
AIzaSyAYiBZKx7MnpbEhh9jyipgxe19OcubqV5w
April 1, 2024
93804
Bulgaria
BGR
true
2
1
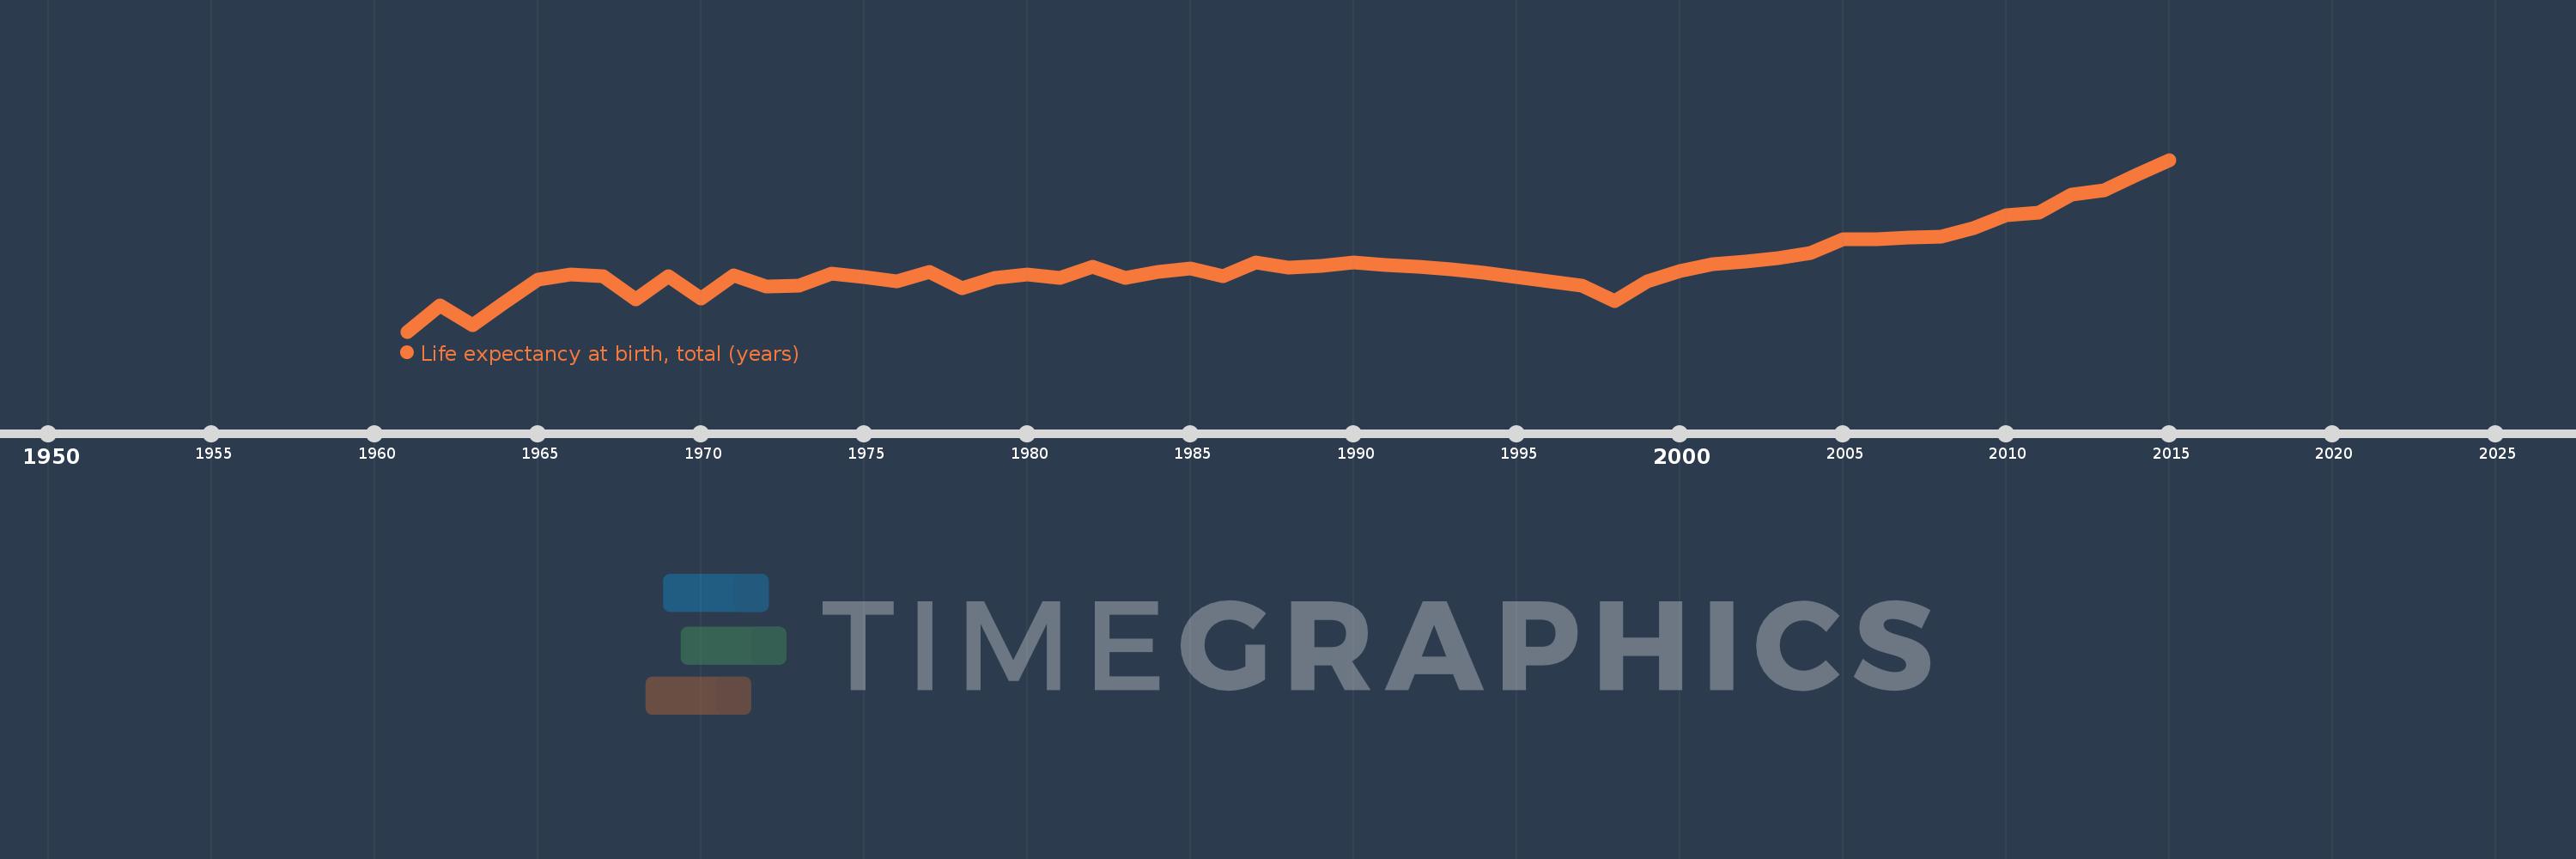
Life expectancy at birth, total (years)
2015,2014,2013,2012,2011,2010,2009,2008,2007,2006,2005,2004,2003,2002,2001,2000,1999,1998,1997,1996,1995,1994,1993,1992,1991,1990,1989,1988,1987,1986,1985,1984,1983,1982,1981,1980,1979,1978,1977,1976,1975,1974,1973,1972,1971,1970,1969,1968,1967,1966,1965,1964,1963,1962,1961
Estas estatísticas em outros países:
AfghanistanAlbaniaAlgeriaAngolaAntigua and BarbudaArab WorldArgentinaArmeniaArubaAustraliaAustriaAzerbaijanBahamas, TheBahrainBangladeshBarbadosBelarusBelgiumBelizeBeninBermudaBhutanBoliviaBosnia and HerzegovinaBotswanaBrazilBrunei DarussalamBulgariaBurkina FasoBurundiCabo VerdeCambodiaCameroonCanadaCaribbean small statesCentral African RepublicCentral Europe and the BalticsChadChannel IslandsChileChinaColombiaComorosCongo, Dem. Rep.Congo, Rep.Costa RicaCote d'IvoireCroatiaCubaCuracaoCyprusCzech RepublicDenmarkDjiboutiDominicaDominican RepublicEarly-demographic dividendEast Asia & PacificEast Asia & Pacific (excluding high income)East Asia & Pacific (IDA & IBRD countries)EcuadorEgypt, Arab Rep.El SalvadorEquatorial GuineaEritreaEstoniaEthiopiaEuro areaEurope & Central AsiaEurope & Central Asia (excluding high income)Europe & Central Asia (IDA & IBRD countries)European UnionFaroe IslandsFijiFinlandFragile and conflict affected situationsFranceFrench PolynesiaGabonGambia, TheGeorgiaGermanyGhanaGreeceGreenlandGrenadaGuamGuatemalaGuineaGuinea-BissauGuyanaHaitiHeavily indebted poor countries (HIPC)High incomeHondurasHong Kong SAR, ChinaHungaryIBRD onlyIcelandIDA & IBRD totalIDA blendIDA onlyIDA totalIndiaIndonesiaIran, Islamic Rep.IraqIrelandIsle of ManIsraelItalyJamaicaJapanJordanKazakhstanKenyaKiribatiKorea, Dem. People’s Rep.Korea, Rep.KosovoKuwaitKyrgyz RepublicLao PDRLate-demographic dividendLatin America & Caribbean Latin America & Caribbean (excluding high income)Latin America & the Caribbean (IDA & IBRD countries)LatviaLeast developed countries: UN classificationLebanonLesothoLiberiaLibyaLiechtensteinLithuaniaLow & middle incomeLow incomeLower middle incomeLuxembourgMacao SAR, ChinaMacedonia, FYRMadagascarMalawiMalaysiaMaldivesMaliMaltaMarshall IslandsMauritaniaMauritiusMexicoMicronesia, Fed. Sts.Middle East & North AfricaMiddle East & North Africa (excluding high income)Middle East & North Africa (IDA & IBRD countries)Middle incomeMoldovaMongoliaMontenegroMoroccoMozambiqueMyanmarNamibiaNepalNetherlandsNew CaledoniaNew ZealandNicaraguaNigerNigeriaNorth AmericaNorwayOECD membersOmanOther small statesPacific island small statesPakistanPalauPanamaPapua New GuineaParaguayPeruPhilippinesPolandPortugalPost-demographic dividendPre-demographic dividendPuerto RicoQatarRomaniaRussian FederationRwandaSamoaSan MarinoSao Tome and PrincipeSaudi ArabiaSenegalSerbiaSeychellesSierra LeoneSingaporeSint Maarten (Dutch part)Slovak RepublicSloveniaSmall statesSolomon IslandsSomaliaSouth AfricaSouth AsiaSouth Asia (IDA & IBRD)South SudanSpainSri LankaSt. Kitts and NevisSt. LuciaSt. Martin (French part)St. Vincent and the GrenadinesSub-Saharan Africa Sub-Saharan Africa (excluding high income)Sub-Saharan Africa (IDA & IBRD countries)SudanSurinameSwazilandSwedenSwitzerlandSyrian Arab RepublicTajikistanTanzaniaThailandTimor-LesteTogoTongaTrinidad and TobagoTunisiaTurkeyTurkmenistanUgandaUkraineUnited Arab EmiratesUnited KingdomUnited StatesUpper middle incomeUruguayUzbekistanVanuatuVenezuela, RBVietnamVirgin Islands (U.S.)West Bank and GazaWorldYemen, Rep.ZambiaZimbabwe Linha do tempo:
Nesta escala de tempo está apresentado um gráfico de 1961 ano até 2015 ano Bulgaria. Dados de 1960 ano ausente. O número de observações reais por data: 55.
Fonte (nome):
Indicadores de desenvolvimento mundial
Fonte (organização):
Derived from male and female life expectancy at birth from sources such as: (1) United Nations Population Division. World Population Prospects, (2) Census reports and other statistical publications from national statistical offices, (3) Eurostat: Demographic Statistics, (4) United Nations Statistical Division. Population and Vital Statistics Reprot (various years), (5) U.S. Census Bureau: International Database, and (6) Secretariat of the Pacific Community: Statistics and Demography Programme.
Categorias:
Health
Foi atualizado:
23 abr 2017 ano
Indicadores de alterações dos valores ao longo dos anos
Mínimo:
69.248
1 jan 1961 ano
Máximo:
75.407
1 jan 2015 ano
Na data de observação
Valor
Mudança absoluta
A alteração em relação ao valor anterior
1 jan 1961 ano
69.248
+69.248
0.0%
1 jan 1962 ano
70.196
+0.948
1.37%
1 jan 1963 ano
69.492
-0.704
-1.0%
1 jan 1964 ano
70.309
+0.817
1.18%
1 jan 1965 ano
71.121
+0.812
1.15%
1 jan 1966 ano
71.294
+0.173
0.24%
1 jan 1967 ano
71.223
-0.07
-0.1%
1 jan 1968 ano
70.414
-0.81
-1.14%
1 jan 1969 ano
71.225
+0.811
1.15%
1 jan 1970 ano
70.43
-0.795
-1.12%
1 jan 1971 ano
71.256
+0.826
1.17%
1 jan 1972 ano
70.874
-0.383
-0.54%
1 jan 1973 ano
70.9
+0.026
0.04%
1 jan 1974 ano
71.342
+0.443
0.62%
1 jan 1975 ano
71.208
-0.134
-0.19%
1 jan 1976 ano
71.05
-0.158
-0.22%
1 jan 1977 ano
71.395
+0.345
0.49%
1 jan 1978 ano
70.816
-0.579
-0.81%
1 jan 1979 ano
71.185
+0.369
0.52%
1 jan 1980 ano
71.308
+0.124
0.17%
1 jan 1981 ano
71.158
-0.151
-0.21%
1 jan 1982 ano
71.572
+0.414
0.58%
1 jan 1983 ano
71.186
-0.386
-0.54%
1 jan 1984 ano
71.386
+0.2
0.28%
1 jan 1985 ano
71.5
+0.113
0.16%
1 jan 1986 ano
71.228
-0.272
-0.38%
1 jan 1987 ano
71.731
+0.503
0.71%
1 jan 1988 ano
71.527
-0.204
-0.28%
1 jan 1989 ano
71.604
+0.078
0.11%
1 jan 1990 ano
71.722
+0.118
0.16%
1 jan 1991 ano
71.641
-0.081
-0.11%
1 jan 1992 ano
71.561
-0.08
-0.11%
1 jan 1993 ano
71.494
-0.067
-0.09%
1 jan 1994 ano
71.347
-0.148
-0.21%
1 jan 1995 ano
71.209
-0.138
-0.19%
1 jan 1996 ano
71.053
-0.155
-0.22%
1 jan 1997 ano
70.897
-0.156
-0.22%
1 jan 1998 ano
70.351
-0.546
-0.77%
1 jan 1999 ano
71.061
+0.71
1.01%
1 jan 2000 ano
71.412
+0.351
0.49%
1 jan 2001 ano
71.663
+0.251
0.35%
1 jan 2002 ano
71.768
+0.105
0.15%
1 jan 2003 ano
71.866
+0.098
0.14%
1 jan 2004 ano
72.066
+0.2
0.28%
1 jan 2005 ano
72.563
+0.498
0.69%
1 jan 2006 ano
72.561
-0.002
0.0%
1 jan 2007 ano
72.612
+0.051
0.07%
1 jan 2008 ano
72.663
+0.051
0.07%
1 jan 2009 ano
72.963
+0.3
0.41%
1 jan 2010 ano
73.412
+0.449
0.62%
1 jan 2011 ano
73.512
+0.1
0.14%
1 jan 2012 ano
74.163
+0.651
0.89%
1 jan 2013 ano
74.315
+0.151
0.2%
1 jan 2014 ano
74.861
+0.546
0.74%
1 jan 2015 ano
75.407
+0.546
0.73%
Classificação de países por estatísticas atuais por anos


Comentários: