29
/pt/
pt
AIzaSyAYiBZKx7MnpbEhh9jyipgxe19OcubqV5w
April 1, 2024
229990
Russian Federation
RUS
true
2
1
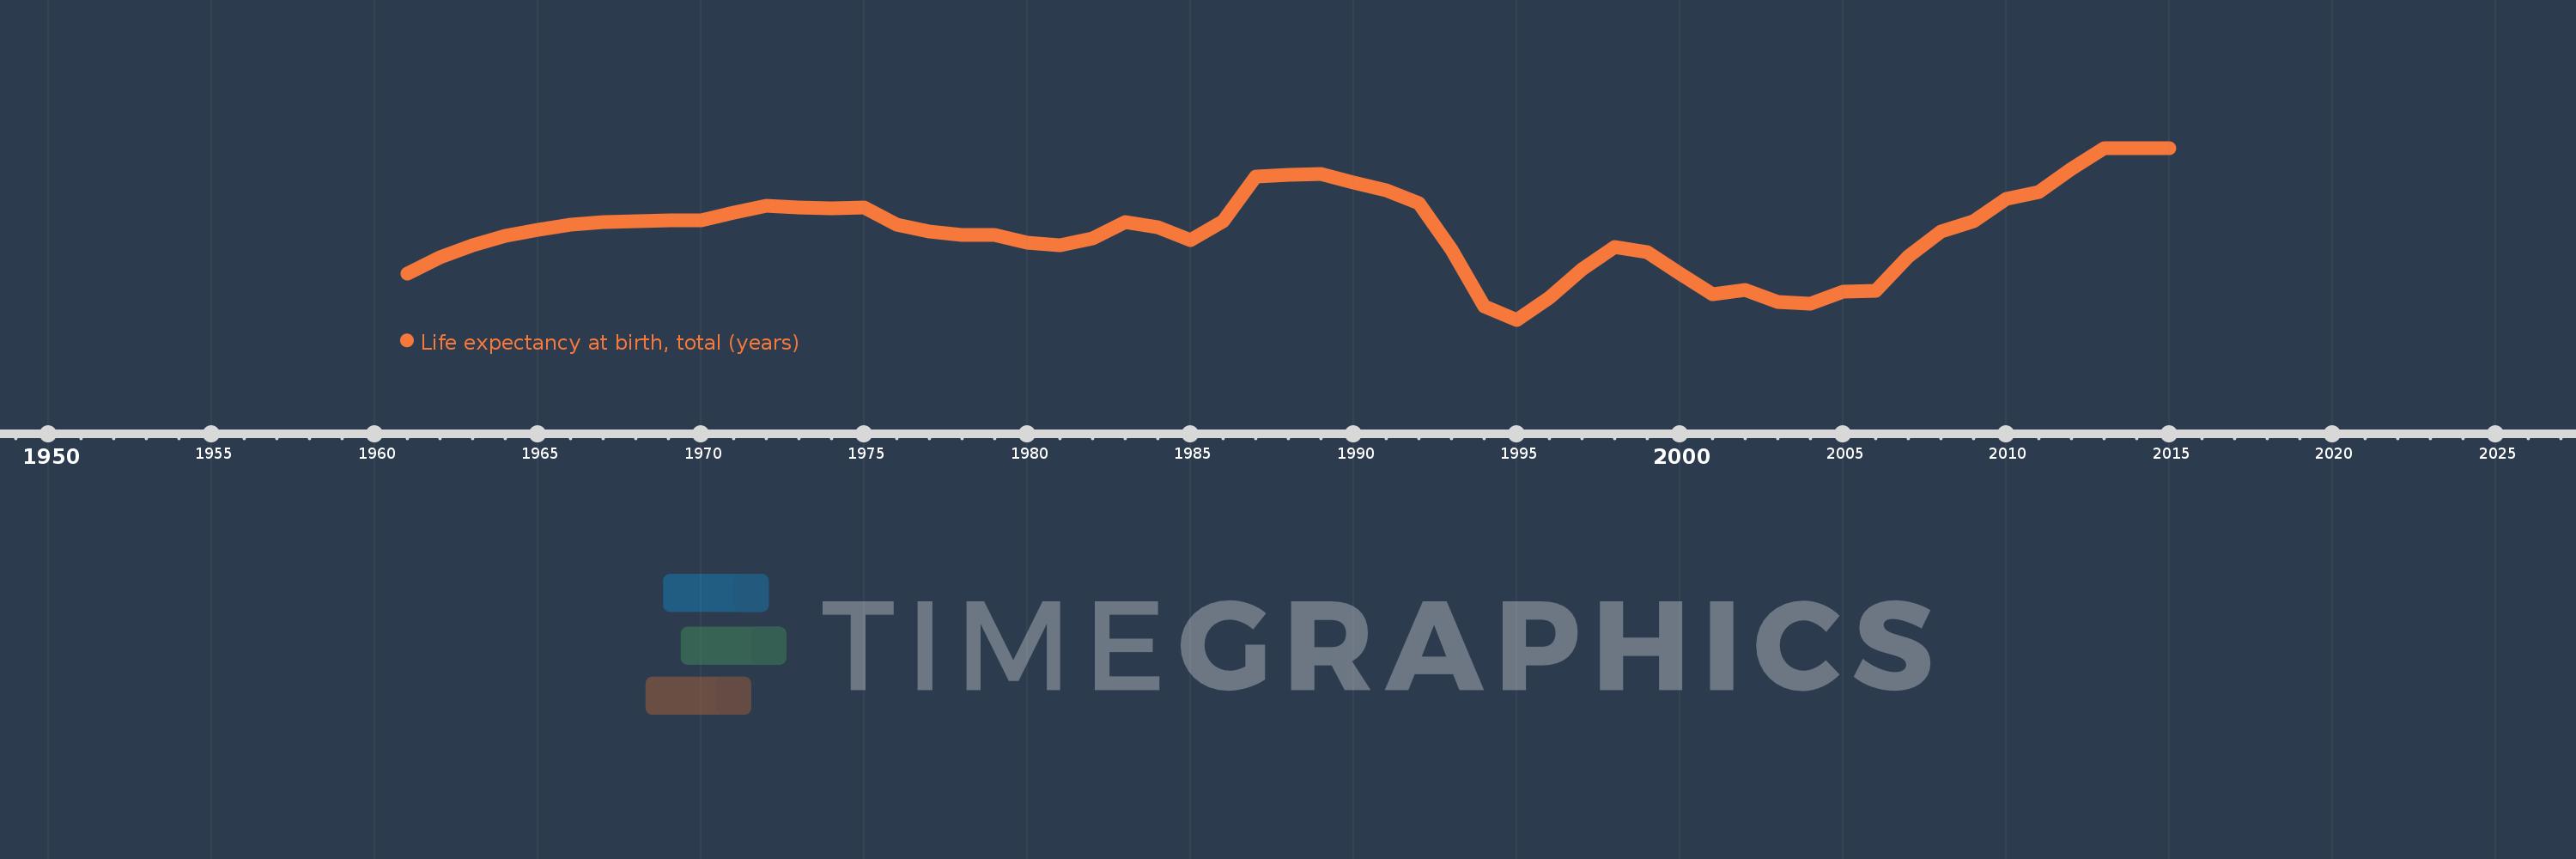
Life expectancy at birth, total (years)
2015,2014,2013,2012,2011,2010,2009,2008,2007,2006,2005,2004,2003,2002,2001,2000,1999,1998,1997,1996,1995,1994,1993,1992,1991,1990,1989,1988,1987,1986,1985,1984,1983,1982,1981,1980,1979,1978,1977,1976,1975,1974,1973,1972,1971,1970,1969,1968,1967,1966,1965,1964,1963,1962,1961
Estas estatísticas em outros países:
AfghanistanAlbaniaAlgeriaAngolaAntigua and BarbudaArab WorldArgentinaArmeniaArubaAustraliaAustriaAzerbaijanBahamas, TheBahrainBangladeshBarbadosBelarusBelgiumBelizeBeninBermudaBhutanBoliviaBosnia and HerzegovinaBotswanaBrazilBrunei DarussalamBulgariaBurkina FasoBurundiCabo VerdeCambodiaCameroonCanadaCaribbean small statesCentral African RepublicCentral Europe and the BalticsChadChannel IslandsChileChinaColombiaComorosCongo, Dem. Rep.Congo, Rep.Costa RicaCote d'IvoireCroatiaCubaCuracaoCyprusCzech RepublicDenmarkDjiboutiDominicaDominican RepublicEarly-demographic dividendEast Asia & PacificEast Asia & Pacific (excluding high income)East Asia & Pacific (IDA & IBRD countries)EcuadorEgypt, Arab Rep.El SalvadorEquatorial GuineaEritreaEstoniaEthiopiaEuro areaEurope & Central AsiaEurope & Central Asia (excluding high income)Europe & Central Asia (IDA & IBRD countries)European UnionFaroe IslandsFijiFinlandFragile and conflict affected situationsFranceFrench PolynesiaGabonGambia, TheGeorgiaGermanyGhanaGreeceGreenlandGrenadaGuamGuatemalaGuineaGuinea-BissauGuyanaHaitiHeavily indebted poor countries (HIPC)High incomeHondurasHong Kong SAR, ChinaHungaryIBRD onlyIcelandIDA & IBRD totalIDA blendIDA onlyIDA totalIndiaIndonesiaIran, Islamic Rep.IraqIrelandIsle of ManIsraelItalyJamaicaJapanJordanKazakhstanKenyaKiribatiKorea, Dem. People’s Rep.Korea, Rep.KosovoKuwaitKyrgyz RepublicLao PDRLate-demographic dividendLatin America & Caribbean Latin America & Caribbean (excluding high income)Latin America & the Caribbean (IDA & IBRD countries)LatviaLeast developed countries: UN classificationLebanonLesothoLiberiaLibyaLiechtensteinLithuaniaLow & middle incomeLow incomeLower middle incomeLuxembourgMacao SAR, ChinaMacedonia, FYRMadagascarMalawiMalaysiaMaldivesMaliMaltaMarshall IslandsMauritaniaMauritiusMexicoMicronesia, Fed. Sts.Middle East & North AfricaMiddle East & North Africa (excluding high income)Middle East & North Africa (IDA & IBRD countries)Middle incomeMoldovaMongoliaMontenegroMoroccoMozambiqueMyanmarNamibiaNepalNetherlandsNew CaledoniaNew ZealandNicaraguaNigerNigeriaNorth AmericaNorwayOECD membersOmanOther small statesPacific island small statesPakistanPalauPanamaPapua New GuineaParaguayPeruPhilippinesPolandPortugalPost-demographic dividendPre-demographic dividendPuerto RicoQatarRomaniaRussian FederationRwandaSamoaSan MarinoSao Tome and PrincipeSaudi ArabiaSenegalSerbiaSeychellesSierra LeoneSingaporeSint Maarten (Dutch part)Slovak RepublicSloveniaSmall statesSolomon IslandsSomaliaSouth AfricaSouth AsiaSouth Asia (IDA & IBRD)South SudanSpainSri LankaSt. Kitts and NevisSt. LuciaSt. Martin (French part)St. Vincent and the GrenadinesSub-Saharan Africa Sub-Saharan Africa (excluding high income)Sub-Saharan Africa (IDA & IBRD countries)SudanSurinameSwazilandSwedenSwitzerlandSyrian Arab RepublicTajikistanTanzaniaThailandTimor-LesteTogoTongaTrinidad and TobagoTunisiaTurkeyTurkmenistanUgandaUkraineUnited Arab EmiratesUnited KingdomUnited StatesUpper middle incomeUruguayUzbekistanVanuatuVenezuela, RBVietnamVirgin Islands (U.S.)West Bank and GazaWorldYemen, Rep.ZambiaZimbabwe Linha do tempo:
Nesta escala de tempo está apresentado um gráfico de 1961 ano até 2015 ano Russian Federation. Dados de 1960 ano ausente. O número de observações reais por data: 55.
Fonte (nome):
Indicadores de desenvolvimento mundial
Fonte (organização):
Derived from male and female life expectancy at birth from sources such as: (1) United Nations Population Division. World Population Prospects, (2) Census reports and other statistical publications from national statistical offices, (3) Eurostat: Demographic Statistics, (4) United Nations Statistical Division. Population and Vital Statistics Reprot (various years), (5) U.S. Census Bureau: International Database, and (6) Secretariat of the Pacific Community: Statistics and Demography Programme.
Categorias:
Health
Foi atualizado:
23 abr 2017 ano
Indicadores de alterações dos valores ao longo dos anos
Mínimo:
64.467
1 jan 1995 ano
Máximo:
70.366
1 jan 2013 ano
Na data de observação
Valor
Mudança absoluta
A alteração em relação ao valor anterior
1 jan 1961 ano
66.055
+66.055
0.0%
1 jan 1962 ano
66.597
+0.542
0.82%
1 jan 1963 ano
67.021
+0.424
0.64%
1 jan 1964 ano
67.34
+0.318
0.48%
1 jan 1965 ano
67.567
+0.227
0.34%
1 jan 1966 ano
67.719
+0.152
0.23%
1 jan 1967 ano
67.813
+0.094
0.14%
1 jan 1968 ano
67.86
+0.048
0.07%
1 jan 1969 ano
67.874
+0.014
0.02%
1 jan 1970 ano
67.867
-0.007
-0.01%
1 jan 1971 ano
68.134
+0.267
0.39%
1 jan 1972 ano
68.377
+0.243
0.36%
1 jan 1973 ano
68.309
-0.068
-0.1%
1 jan 1974 ano
68.295
-0.014
-0.02%
1 jan 1975 ano
68.32
+0.026
0.04%
1 jan 1976 ano
67.724
-0.596
-0.87%
1 jan 1977 ano
67.488
-0.236
-0.35%
1 jan 1978 ano
67.376
-0.111
-0.16%
1 jan 1979 ano
67.391
+0.015
0.02%
1 jan 1980 ano
67.114
-0.277
-0.41%
1 jan 1981 ano
67.034
-0.08
-0.12%
1 jan 1982 ano
67.264
+0.23
0.34%
1 jan 1983 ano
67.806
+0.542
0.81%
1 jan 1984 ano
67.653
-0.153
-0.23%
1 jan 1985 ano
67.203
-0.45
-0.67%
1 jan 1986 ano
67.857
+0.654
0.97%
1 jan 1987 ano
69.39
+1.533
2.26%
1 jan 1988 ano
69.44
+0.05
0.07%
1 jan 1989 ano
69.464
+0.024
0.04%
1 jan 1990 ano
69.172
-0.293
-0.42%
1 jan 1991 ano
68.902
-0.269
-0.39%
1 jan 1992 ano
68.474
-0.428
-0.62%
1 jan 1993 ano
66.873
-1.601
-2.34%
1 jan 1994 ano
64.936
-1.937
-2.9%
1 jan 1995 ano
64.467
-0.469
-0.72%
1 jan 1996 ano
65.221
+0.754
1.17%
1 jan 1997 ano
66.194
+0.973
1.49%
1 jan 1998 ano
66.951
+0.757
1.14%
1 jan 1999 ano
66.784
-0.167
-0.25%
1 jan 2000 ano
66.044
-0.74
-1.11%
1 jan 2001 ano
65.341
-0.702
-1.06%
1 jan 2002 ano
65.488
+0.146
0.22%
1 jan 2003 ano
65.085
-0.402
-0.61%
1 jan 2004 ano
65.008
-0.078
-0.12%
1 jan 2005 ano
65.421
+0.414
0.64%
1 jan 2006 ano
65.47
+0.049
0.07%
1 jan 2007 ano
66.643
+1.173
1.79%
1 jan 2008 ano
67.498
+0.854
1.28%
1 jan 2009 ano
67.849
+0.351
0.52%
1 jan 2010 ano
68.605
+0.756
1.11%
1 jan 2011 ano
68.856
+0.251
0.37%
1 jan 2012 ano
69.659
+0.802
1.17%
1 jan 2013 ano
70.366
+0.707
1.02%
1 jan 2014 ano
70.366
0.0
0.0%
1 jan 2015 ano
70.366
0.0
0.0%
Classificação de países por estatísticas atuais por anos


Comentários: