29
/pt/
pt
AIzaSyAYiBZKx7MnpbEhh9jyipgxe19OcubqV5w
April 1, 2024
245831
South Africa
ZAF
true
2
1
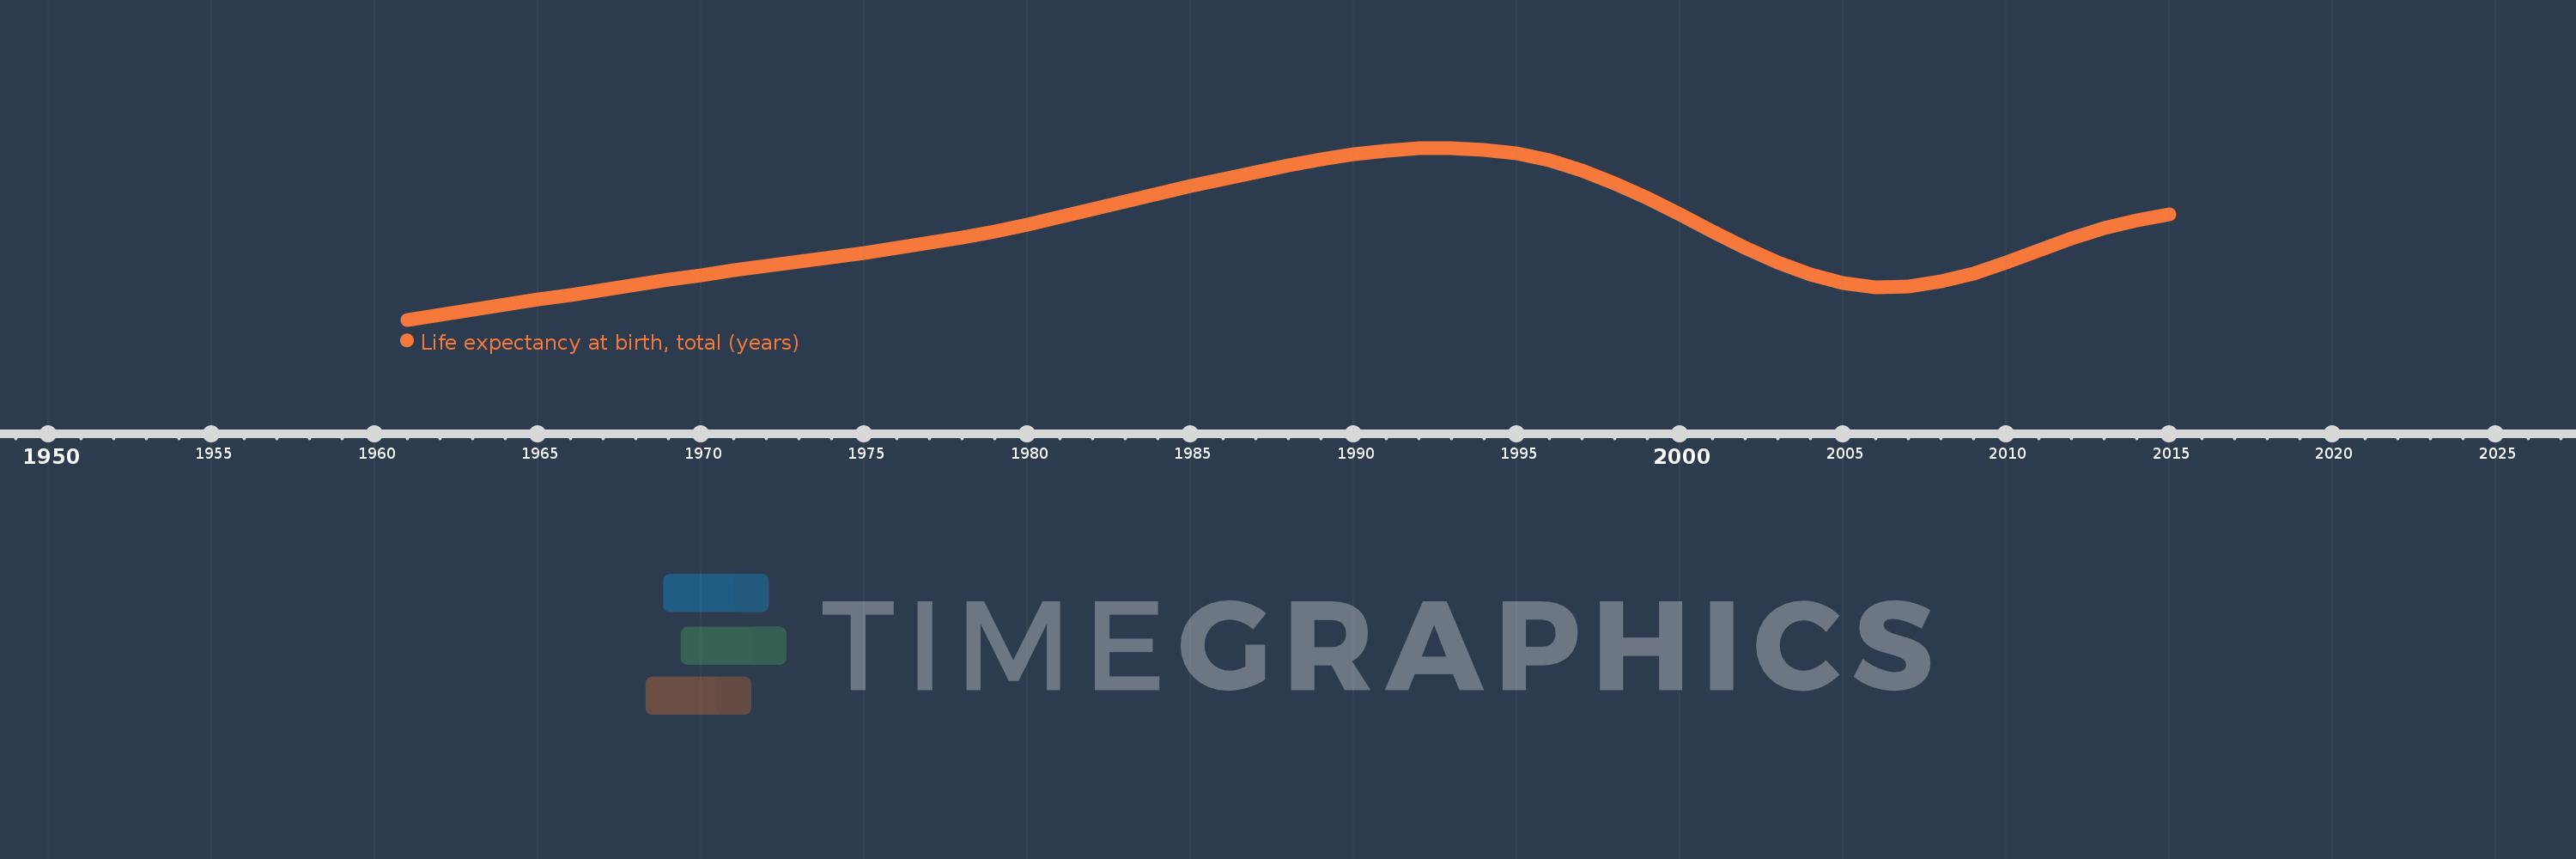
Life expectancy at birth, total (years)
2015,2014,2013,2012,2011,2010,2009,2008,2007,2006,2005,2004,2003,2002,2001,2000,1999,1998,1997,1996,1995,1994,1993,1992,1991,1990,1989,1988,1987,1986,1985,1984,1983,1982,1981,1980,1979,1978,1977,1976,1975,1974,1973,1972,1971,1970,1969,1968,1967,1966,1965,1964,1963,1962,1961
Estas estatísticas em outros países:
AfghanistanAlbaniaAlgeriaAngolaAntigua and BarbudaArab WorldArgentinaArmeniaArubaAustraliaAustriaAzerbaijanBahamas, TheBahrainBangladeshBarbadosBelarusBelgiumBelizeBeninBermudaBhutanBoliviaBosnia and HerzegovinaBotswanaBrazilBrunei DarussalamBulgariaBurkina FasoBurundiCabo VerdeCambodiaCameroonCanadaCaribbean small statesCentral African RepublicCentral Europe and the BalticsChadChannel IslandsChileChinaColombiaComorosCongo, Dem. Rep.Congo, Rep.Costa RicaCote d'IvoireCroatiaCubaCuracaoCyprusCzech RepublicDenmarkDjiboutiDominicaDominican RepublicEarly-demographic dividendEast Asia & PacificEast Asia & Pacific (excluding high income)East Asia & Pacific (IDA & IBRD countries)EcuadorEgypt, Arab Rep.El SalvadorEquatorial GuineaEritreaEstoniaEthiopiaEuro areaEurope & Central AsiaEurope & Central Asia (excluding high income)Europe & Central Asia (IDA & IBRD countries)European UnionFaroe IslandsFijiFinlandFragile and conflict affected situationsFranceFrench PolynesiaGabonGambia, TheGeorgiaGermanyGhanaGreeceGreenlandGrenadaGuamGuatemalaGuineaGuinea-BissauGuyanaHaitiHeavily indebted poor countries (HIPC)High incomeHondurasHong Kong SAR, ChinaHungaryIBRD onlyIcelandIDA & IBRD totalIDA blendIDA onlyIDA totalIndiaIndonesiaIran, Islamic Rep.IraqIrelandIsle of ManIsraelItalyJamaicaJapanJordanKazakhstanKenyaKiribatiKorea, Dem. People’s Rep.Korea, Rep.KosovoKuwaitKyrgyz RepublicLao PDRLate-demographic dividendLatin America & Caribbean Latin America & Caribbean (excluding high income)Latin America & the Caribbean (IDA & IBRD countries)LatviaLeast developed countries: UN classificationLebanonLesothoLiberiaLibyaLiechtensteinLithuaniaLow & middle incomeLow incomeLower middle incomeLuxembourgMacao SAR, ChinaMacedonia, FYRMadagascarMalawiMalaysiaMaldivesMaliMaltaMarshall IslandsMauritaniaMauritiusMexicoMicronesia, Fed. Sts.Middle East & North AfricaMiddle East & North Africa (excluding high income)Middle East & North Africa (IDA & IBRD countries)Middle incomeMoldovaMongoliaMontenegroMoroccoMozambiqueMyanmarNamibiaNepalNetherlandsNew CaledoniaNew ZealandNicaraguaNigerNigeriaNorth AmericaNorwayOECD membersOmanOther small statesPacific island small statesPakistanPalauPanamaPapua New GuineaParaguayPeruPhilippinesPolandPortugalPost-demographic dividendPre-demographic dividendPuerto RicoQatarRomaniaRussian FederationRwandaSamoaSan MarinoSao Tome and PrincipeSaudi ArabiaSenegalSerbiaSeychellesSierra LeoneSingaporeSint Maarten (Dutch part)Slovak RepublicSloveniaSmall statesSolomon IslandsSomaliaSouth AfricaSouth AsiaSouth Asia (IDA & IBRD)South SudanSpainSri LankaSt. Kitts and NevisSt. LuciaSt. Martin (French part)St. Vincent and the GrenadinesSub-Saharan Africa Sub-Saharan Africa (excluding high income)Sub-Saharan Africa (IDA & IBRD countries)SudanSurinameSwazilandSwedenSwitzerlandSyrian Arab RepublicTajikistanTanzaniaThailandTimor-LesteTogoTongaTrinidad and TobagoTunisiaTurkeyTurkmenistanUgandaUkraineUnited Arab EmiratesUnited KingdomUnited StatesUpper middle incomeUruguayUzbekistanVanuatuVenezuela, RBVietnamVirgin Islands (U.S.)West Bank and GazaWorldYemen, Rep.ZambiaZimbabwe Linha do tempo:
Nesta escala de tempo está apresentado um gráfico de 1961 ano até 2015 ano South Africa. Dados de 1960 ano ausente. O número de observações reais por data: 55.
Fonte (nome):
Indicadores de desenvolvimento mundial
Fonte (organização):
Derived from male and female life expectancy at birth from sources such as: (1) United Nations Population Division. World Population Prospects, (2) Census reports and other statistical publications from national statistical offices, (3) Eurostat: Demographic Statistics, (4) United Nations Statistical Division. Population and Vital Statistics Reprot (various years), (5) U.S. Census Bureau: International Database, and (6) Secretariat of the Pacific Community: Statistics and Demography Programme.
Categorias:
Health
Foi atualizado:
23 abr 2017 ano
Indicadores de alterações dos valores ao longo dos anos
Mínimo:
49.036
1 jan 1961 ano
Máximo:
62.325
1 jan 1993 ano
Na data de observação
Valor
Mudança absoluta
A alteração em relação ao valor anterior
1 jan 1961 ano
49.036
+49.036
0.0%
1 jan 1962 ano
49.43
+0.394
0.8%
1 jan 1963 ano
49.813
+0.383
0.78%
1 jan 1964 ano
50.196
+0.382
0.77%
1 jan 1965 ano
50.582
+0.386
0.77%
1 jan 1966 ano
50.972
+0.39
0.77%
1 jan 1967 ano
51.363
+0.391
0.77%
1 jan 1968 ano
51.749
+0.386
0.75%
1 jan 1969 ano
52.126
+0.377
0.73%
1 jan 1970 ano
52.493
+0.367
0.7%
1 jan 1971 ano
52.851
+0.357
0.68%
1 jan 1972 ano
53.196
+0.345
0.65%
1 jan 1973 ano
53.534
+0.337
0.63%
1 jan 1974 ano
53.871
+0.337
0.63%
1 jan 1975 ano
54.213
+0.343
0.64%
1 jan 1976 ano
54.577
+0.363
0.67%
1 jan 1977 ano
54.974
+0.398
0.73%
1 jan 1978 ano
55.412
+0.438
0.8%
1 jan 1979 ano
55.893
+0.48
0.87%
1 jan 1980 ano
56.414
+0.521
0.93%
1 jan 1981 ano
56.973
+0.559
0.99%
1 jan 1982 ano
57.563
+0.59
1.03%
1 jan 1983 ano
58.167
+0.605
1.05%
1 jan 1984 ano
58.769
+0.602
1.03%
1 jan 1985 ano
59.352
+0.584
0.99%
1 jan 1986 ano
59.912
+0.56
0.94%
1 jan 1987 ano
60.45
+0.537
0.9%
1 jan 1988 ano
60.958
+0.509
0.84%
1 jan 1989 ano
61.424
+0.466
0.76%
1 jan 1990 ano
61.82
+0.397
0.65%
1 jan 1991 ano
62.12
+0.3
0.48%
1 jan 1992 ano
62.295
+0.175
0.28%
1 jan 1993 ano
62.325
+0.03
0.05%
1 jan 1994 ano
62.194
-0.131
-0.21%
1 jan 1995 ano
61.888
-0.306
-0.49%
1 jan 1996 ano
61.37
-0.518
-0.84%
1 jan 1997 ano
60.605
-0.765
-1.25%
1 jan 1998 ano
59.613
-0.992
-1.64%
1 jan 1999 ano
58.443
-1.17
-1.96%
1 jan 2000 ano
57.157
-1.286
-2.2%
1 jan 2001 ano
55.837
-1.32
-2.31%
1 jan 2002 ano
54.571
-1.266
-2.27%
1 jan 2003 ano
53.441
-1.13
-2.07%
1 jan 2004 ano
52.524
-0.917
-1.72%
1 jan 2005 ano
51.874
-0.65
-1.24%
1 jan 2006 ano
51.557
-0.316
-0.61%
1 jan 2007 ano
51.614
+0.056
0.11%
1 jan 2008 ano
51.997
+0.383
0.74%
1 jan 2009 ano
52.636
+0.64
1.23%
1 jan 2010 ano
53.467
+0.831
1.58%
1 jan 2011 ano
54.391
+0.924
1.73%
1 jan 2012 ano
55.296
+0.905
1.66%
1 jan 2013 ano
56.098
+0.803
1.45%
1 jan 2014 ano
56.737
+0.638
1.14%
1 jan 2015 ano
57.182
+0.446
0.79%
Classificação de países por estatísticas atuais por anos


Comentários: