29
/pt/
pt
AIzaSyAYiBZKx7MnpbEhh9jyipgxe19OcubqV5w
April 1, 2024
270683
Turkmenistan
TKM
true
2
1
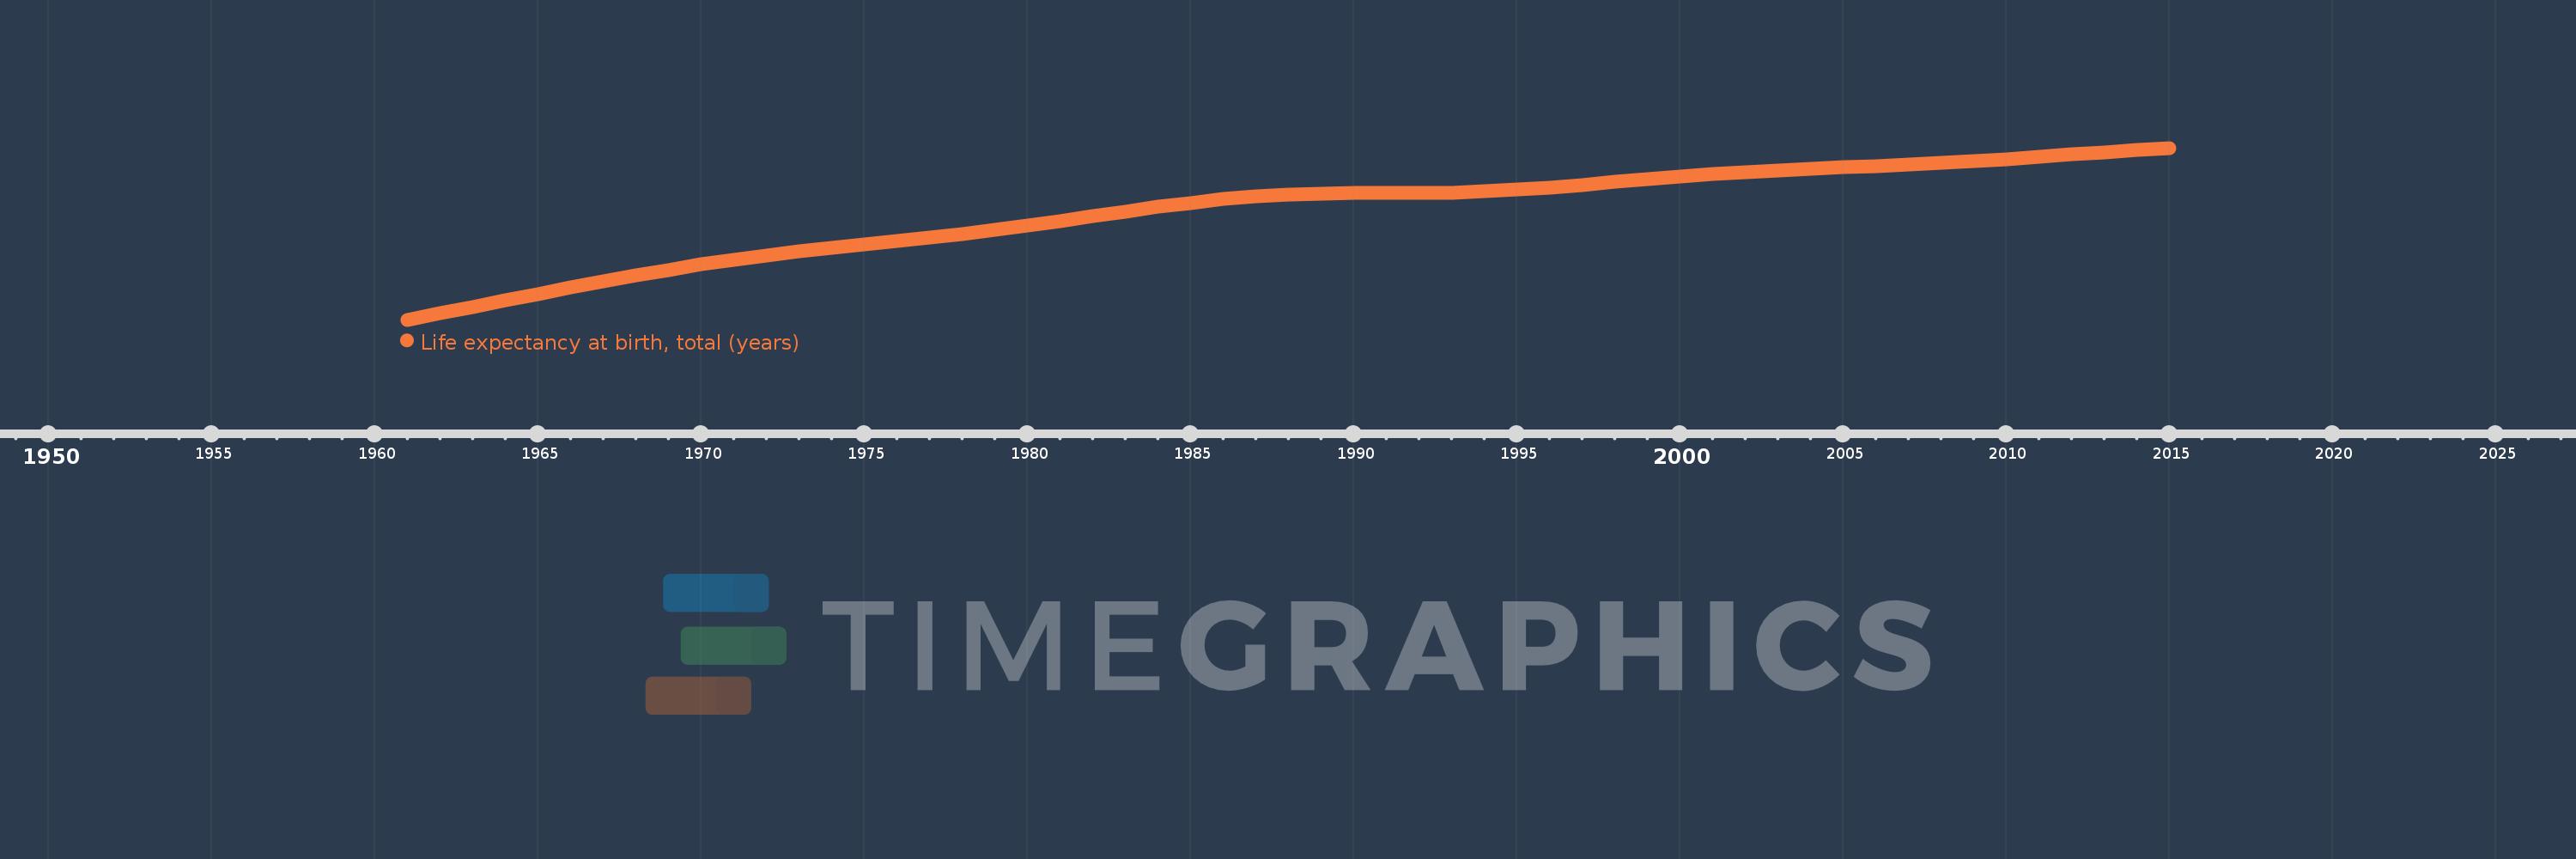
Life expectancy at birth, total (years)
2015,2014,2013,2012,2011,2010,2009,2008,2007,2006,2005,2004,2003,2002,2001,2000,1999,1998,1997,1996,1995,1994,1993,1992,1991,1990,1989,1988,1987,1986,1985,1984,1983,1982,1981,1980,1979,1978,1977,1976,1975,1974,1973,1972,1971,1970,1969,1968,1967,1966,1965,1964,1963,1962,1961
Estas estatísticas em outros países:
AfghanistanAlbaniaAlgeriaAngolaAntigua and BarbudaArab WorldArgentinaArmeniaArubaAustraliaAustriaAzerbaijanBahamas, TheBahrainBangladeshBarbadosBelarusBelgiumBelizeBeninBermudaBhutanBoliviaBosnia and HerzegovinaBotswanaBrazilBrunei DarussalamBulgariaBurkina FasoBurundiCabo VerdeCambodiaCameroonCanadaCaribbean small statesCentral African RepublicCentral Europe and the BalticsChadChannel IslandsChileChinaColombiaComorosCongo, Dem. Rep.Congo, Rep.Costa RicaCote d'IvoireCroatiaCubaCuracaoCyprusCzech RepublicDenmarkDjiboutiDominicaDominican RepublicEarly-demographic dividendEast Asia & PacificEast Asia & Pacific (excluding high income)East Asia & Pacific (IDA & IBRD countries)EcuadorEgypt, Arab Rep.El SalvadorEquatorial GuineaEritreaEstoniaEthiopiaEuro areaEurope & Central AsiaEurope & Central Asia (excluding high income)Europe & Central Asia (IDA & IBRD countries)European UnionFaroe IslandsFijiFinlandFragile and conflict affected situationsFranceFrench PolynesiaGabonGambia, TheGeorgiaGermanyGhanaGreeceGreenlandGrenadaGuamGuatemalaGuineaGuinea-BissauGuyanaHaitiHeavily indebted poor countries (HIPC)High incomeHondurasHong Kong SAR, ChinaHungaryIBRD onlyIcelandIDA & IBRD totalIDA blendIDA onlyIDA totalIndiaIndonesiaIran, Islamic Rep.IraqIrelandIsle of ManIsraelItalyJamaicaJapanJordanKazakhstanKenyaKiribatiKorea, Dem. People’s Rep.Korea, Rep.KosovoKuwaitKyrgyz RepublicLao PDRLate-demographic dividendLatin America & Caribbean Latin America & Caribbean (excluding high income)Latin America & the Caribbean (IDA & IBRD countries)LatviaLeast developed countries: UN classificationLebanonLesothoLiberiaLibyaLiechtensteinLithuaniaLow & middle incomeLow incomeLower middle incomeLuxembourgMacao SAR, ChinaMacedonia, FYRMadagascarMalawiMalaysiaMaldivesMaliMaltaMarshall IslandsMauritaniaMauritiusMexicoMicronesia, Fed. Sts.Middle East & North AfricaMiddle East & North Africa (excluding high income)Middle East & North Africa (IDA & IBRD countries)Middle incomeMoldovaMongoliaMontenegroMoroccoMozambiqueMyanmarNamibiaNepalNetherlandsNew CaledoniaNew ZealandNicaraguaNigerNigeriaNorth AmericaNorwayOECD membersOmanOther small statesPacific island small statesPakistanPalauPanamaPapua New GuineaParaguayPeruPhilippinesPolandPortugalPost-demographic dividendPre-demographic dividendPuerto RicoQatarRomaniaRussian FederationRwandaSamoaSan MarinoSao Tome and PrincipeSaudi ArabiaSenegalSerbiaSeychellesSierra LeoneSingaporeSint Maarten (Dutch part)Slovak RepublicSloveniaSmall statesSolomon IslandsSomaliaSouth AfricaSouth AsiaSouth Asia (IDA & IBRD)South SudanSpainSri LankaSt. Kitts and NevisSt. LuciaSt. Martin (French part)St. Vincent and the GrenadinesSub-Saharan Africa Sub-Saharan Africa (excluding high income)Sub-Saharan Africa (IDA & IBRD countries)SudanSurinameSwazilandSwedenSwitzerlandSyrian Arab RepublicTajikistanTanzaniaThailandTimor-LesteTogoTongaTrinidad and TobagoTunisiaTurkeyTurkmenistanUgandaUkraineUnited Arab EmiratesUnited KingdomUnited StatesUpper middle incomeUruguayUzbekistanVanuatuVenezuela, RBVietnamVirgin Islands (U.S.)West Bank and GazaWorldYemen, Rep.ZambiaZimbabwe Linha do tempo:
Nesta escala de tempo está apresentado um gráfico de 1961 ano até 2015 ano Turkmenistan. Dados de 1960 ano ausente. O número de observações reais por data: 55.
Fonte (nome):
Indicadores de desenvolvimento mundial
Fonte (organização):
Derived from male and female life expectancy at birth from sources such as: (1) United Nations Population Division. World Population Prospects, (2) Census reports and other statistical publications from national statistical offices, (3) Eurostat: Demographic Statistics, (4) United Nations Statistical Division. Population and Vital Statistics Reprot (various years), (5) U.S. Census Bureau: International Database, and (6) Secretariat of the Pacific Community: Statistics and Demography Programme.
Categorias:
Health
Foi atualizado:
23 abr 2017 ano
Indicadores de alterações dos valores ao longo dos anos
Mínimo:
54.459
1 jan 1961 ano
Máximo:
65.599
1 jan 2015 ano
Na data de observação
Valor
Mudança absoluta
A alteração em relação ao valor anterior
1 jan 1961 ano
54.459
+54.459
0.0%
1 jan 1962 ano
54.871
+0.413
0.76%
1 jan 1963 ano
55.287
+0.416
0.76%
1 jan 1964 ano
55.706
+0.419
0.76%
1 jan 1965 ano
56.123
+0.417
0.75%
1 jan 1966 ano
56.535
+0.413
0.74%
1 jan 1967 ano
56.937
+0.402
0.71%
1 jan 1968 ano
57.325
+0.388
0.68%
1 jan 1969 ano
57.694
+0.369
0.64%
1 jan 1970 ano
58.039
+0.346
0.6%
1 jan 1971 ano
58.358
+0.319
0.55%
1 jan 1972 ano
58.645
+0.287
0.49%
1 jan 1973 ano
58.904
+0.258
0.44%
1 jan 1974 ano
59.14
+0.236
0.4%
1 jan 1975 ano
59.359
+0.219
0.37%
1 jan 1976 ano
59.573
+0.214
0.36%
1 jan 1977 ano
59.794
+0.221
0.37%
1 jan 1978 ano
60.032
+0.237
0.4%
1 jan 1979 ano
60.289
+0.257
0.43%
1 jan 1980 ano
60.566
+0.277
0.46%
1 jan 1981 ano
60.861
+0.295
0.49%
1 jan 1982 ano
61.169
+0.309
0.51%
1 jan 1983 ano
61.478
+0.309
0.5%
1 jan 1984 ano
61.773
+0.294
0.48%
1 jan 1985 ano
62.045
+0.272
0.44%
1 jan 1986 ano
62.276
+0.232
0.37%
1 jan 1987 ano
62.453
+0.177
0.28%
1 jan 1988 ano
62.574
+0.121
0.19%
1 jan 1989 ano
62.643
+0.068
0.11%
1 jan 1990 ano
62.67
+0.028
0.04%
1 jan 1991 ano
62.674
+0.004
0.01%
1 jan 1992 ano
62.678
+0.004
0.01%
1 jan 1993 ano
62.706
+0.028
0.04%
1 jan 1994 ano
62.771
+0.065
0.1%
1 jan 1995 ano
62.881
+0.109
0.17%
1 jan 1996 ano
63.03
+0.15
0.24%
1 jan 1997 ano
63.21
+0.18
0.28%
1 jan 1998 ano
63.4
+0.19
0.3%
1 jan 1999 ano
63.582
+0.182
0.29%
1 jan 2000 ano
63.751
+0.169
0.27%
1 jan 2001 ano
63.899
+0.148
0.23%
1 jan 2002 ano
64.026
+0.127
0.2%
1 jan 2003 ano
64.138
+0.112
0.17%
1 jan 2004 ano
64.24
+0.103
0.16%
1 jan 2005 ano
64.337
+0.097
0.15%
1 jan 2006 ano
64.432
+0.095
0.15%
1 jan 2007 ano
64.532
+0.099
0.15%
1 jan 2008 ano
64.639
+0.107
0.17%
1 jan 2009 ano
64.756
+0.117
0.18%
1 jan 2010 ano
64.884
+0.127
0.2%
1 jan 2011 ano
65.021
+0.138
0.21%
1 jan 2012 ano
65.166
+0.144
0.22%
1 jan 2013 ano
65.312
+0.146
0.22%
1 jan 2014 ano
65.457
+0.145
0.22%
1 jan 2015 ano
65.599
+0.142
0.22%
Classificação de países por estatísticas atuais por anos


Comentários: