29
/pt/
pt
AIzaSyAYiBZKx7MnpbEhh9jyipgxe19OcubqV5w
April 1, 2024
117098
Cyprus
CYP
true
2
1
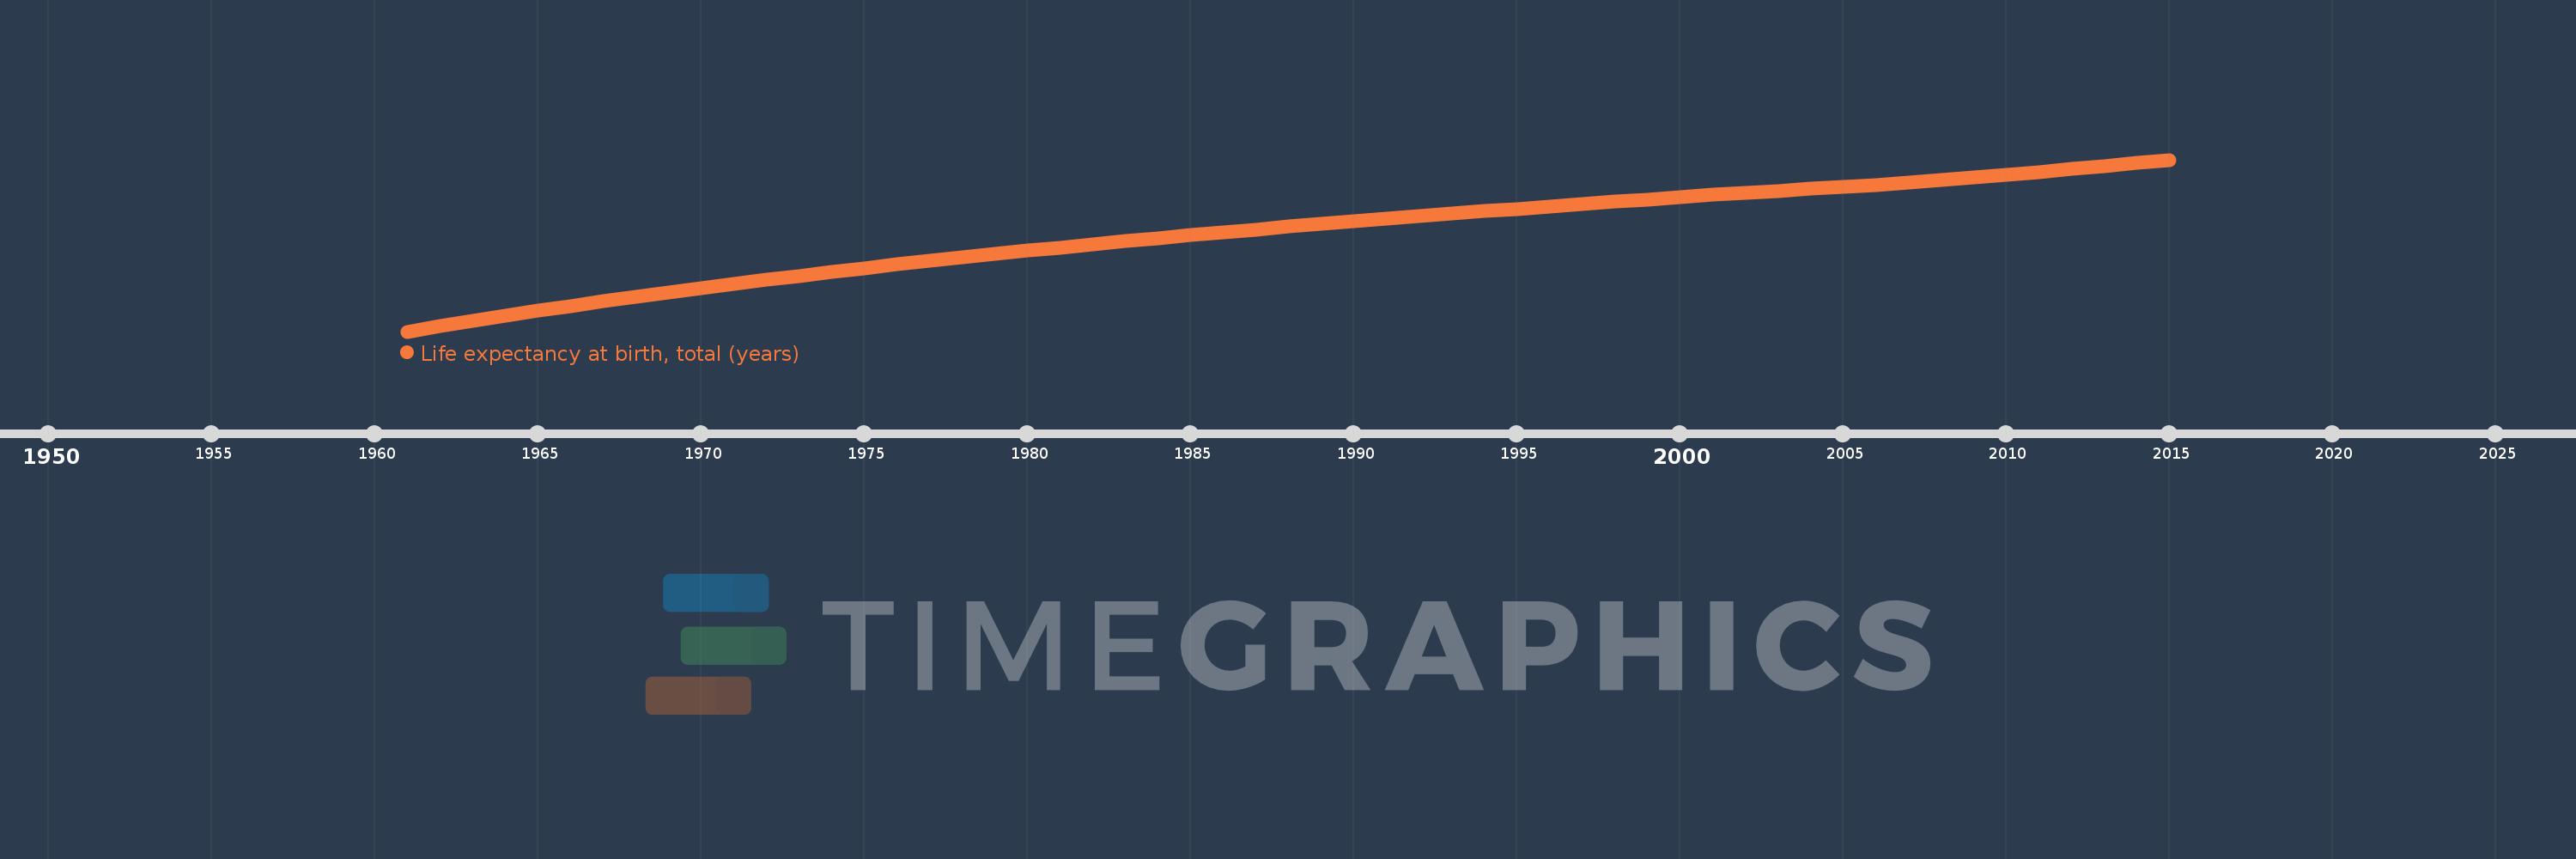
Life expectancy at birth, total (years)
2015,2014,2013,2012,2011,2010,2009,2008,2007,2006,2005,2004,2003,2002,2001,2000,1999,1998,1997,1996,1995,1994,1993,1992,1991,1990,1989,1988,1987,1986,1985,1984,1983,1982,1981,1980,1979,1978,1977,1976,1975,1974,1973,1972,1971,1970,1969,1968,1967,1966,1965,1964,1963,1962,1961
Estas estatísticas em outros países:
AfghanistanAlbaniaAlgeriaAngolaAntigua and BarbudaArab WorldArgentinaArmeniaArubaAustraliaAustriaAzerbaijanBahamas, TheBahrainBangladeshBarbadosBelarusBelgiumBelizeBeninBermudaBhutanBoliviaBosnia and HerzegovinaBotswanaBrazilBrunei DarussalamBulgariaBurkina FasoBurundiCabo VerdeCambodiaCameroonCanadaCaribbean small statesCentral African RepublicCentral Europe and the BalticsChadChannel IslandsChileChinaColombiaComorosCongo, Dem. Rep.Congo, Rep.Costa RicaCote d'IvoireCroatiaCubaCuracaoCyprusCzech RepublicDenmarkDjiboutiDominicaDominican RepublicEarly-demographic dividendEast Asia & PacificEast Asia & Pacific (excluding high income)East Asia & Pacific (IDA & IBRD countries)EcuadorEgypt, Arab Rep.El SalvadorEquatorial GuineaEritreaEstoniaEthiopiaEuro areaEurope & Central AsiaEurope & Central Asia (excluding high income)Europe & Central Asia (IDA & IBRD countries)European UnionFaroe IslandsFijiFinlandFragile and conflict affected situationsFranceFrench PolynesiaGabonGambia, TheGeorgiaGermanyGhanaGreeceGreenlandGrenadaGuamGuatemalaGuineaGuinea-BissauGuyanaHaitiHeavily indebted poor countries (HIPC)High incomeHondurasHong Kong SAR, ChinaHungaryIBRD onlyIcelandIDA & IBRD totalIDA blendIDA onlyIDA totalIndiaIndonesiaIran, Islamic Rep.IraqIrelandIsle of ManIsraelItalyJamaicaJapanJordanKazakhstanKenyaKiribatiKorea, Dem. People’s Rep.Korea, Rep.KosovoKuwaitKyrgyz RepublicLao PDRLate-demographic dividendLatin America & Caribbean Latin America & Caribbean (excluding high income)Latin America & the Caribbean (IDA & IBRD countries)LatviaLeast developed countries: UN classificationLebanonLesothoLiberiaLibyaLiechtensteinLithuaniaLow & middle incomeLow incomeLower middle incomeLuxembourgMacao SAR, ChinaMacedonia, FYRMadagascarMalawiMalaysiaMaldivesMaliMaltaMarshall IslandsMauritaniaMauritiusMexicoMicronesia, Fed. Sts.Middle East & North AfricaMiddle East & North Africa (excluding high income)Middle East & North Africa (IDA & IBRD countries)Middle incomeMoldovaMongoliaMontenegroMoroccoMozambiqueMyanmarNamibiaNepalNetherlandsNew CaledoniaNew ZealandNicaraguaNigerNigeriaNorth AmericaNorwayOECD membersOmanOther small statesPacific island small statesPakistanPalauPanamaPapua New GuineaParaguayPeruPhilippinesPolandPortugalPost-demographic dividendPre-demographic dividendPuerto RicoQatarRomaniaRussian FederationRwandaSamoaSan MarinoSao Tome and PrincipeSaudi ArabiaSenegalSerbiaSeychellesSierra LeoneSingaporeSint Maarten (Dutch part)Slovak RepublicSloveniaSmall statesSolomon IslandsSomaliaSouth AfricaSouth AsiaSouth Asia (IDA & IBRD)South SudanSpainSri LankaSt. Kitts and NevisSt. LuciaSt. Martin (French part)St. Vincent and the GrenadinesSub-Saharan Africa Sub-Saharan Africa (excluding high income)Sub-Saharan Africa (IDA & IBRD countries)SudanSurinameSwazilandSwedenSwitzerlandSyrian Arab RepublicTajikistanTanzaniaThailandTimor-LesteTogoTongaTrinidad and TobagoTunisiaTurkeyTurkmenistanUgandaUkraineUnited Arab EmiratesUnited KingdomUnited StatesUpper middle incomeUruguayUzbekistanVanuatuVenezuela, RBVietnamVirgin Islands (U.S.)West Bank and GazaWorldYemen, Rep.ZambiaZimbabwe Linha do tempo:
Nesta escala de tempo está apresentado um gráfico de 1961 ano até 2015 ano Cyprus. Dados de 1960 ano ausente. O número de observações reais por data: 55.
Fonte (nome):
Indicadores de desenvolvimento mundial
Fonte (organização):
Derived from male and female life expectancy at birth from sources such as: (1) United Nations Population Division. World Population Prospects, (2) Census reports and other statistical publications from national statistical offices, (3) Eurostat: Demographic Statistics, (4) United Nations Statistical Division. Population and Vital Statistics Reprot (various years), (5) U.S. Census Bureau: International Database, and (6) Secretariat of the Pacific Community: Statistics and Demography Programme.
Categorias:
Health
Foi atualizado:
23 abr 2017 ano
Indicadores de alterações dos valores ao longo dos anos
Mínimo:
69.594
1 jan 1961 ano
Máximo:
80.132
1 jan 2015 ano
Na data de observação
Valor
Mudança absoluta
A alteração em relação ao valor anterior
1 jan 1961 ano
69.594
+69.594
0.0%
1 jan 1962 ano
69.928
+0.334
0.48%
1 jan 1963 ano
70.251
+0.323
0.46%
1 jan 1964 ano
70.565
+0.313
0.45%
1 jan 1965 ano
70.869
+0.304
0.43%
1 jan 1966 ano
71.165
+0.296
0.42%
1 jan 1967 ano
71.453
+0.287
0.4%
1 jan 1968 ano
71.731
+0.278
0.39%
1 jan 1969 ano
72.002
+0.271
0.38%
1 jan 1970 ano
72.266
+0.263
0.37%
1 jan 1971 ano
72.523
+0.257
0.36%
1 jan 1972 ano
72.773
+0.25
0.34%
1 jan 1973 ano
73.017
+0.244
0.34%
1 jan 1974 ano
73.254
+0.237
0.33%
1 jan 1975 ano
73.485
+0.231
0.32%
1 jan 1976 ano
73.71
+0.225
0.31%
1 jan 1977 ano
73.93
+0.22
0.3%
1 jan 1978 ano
74.145
+0.214
0.29%
1 jan 1979 ano
74.354
+0.209
0.28%
1 jan 1980 ano
74.558
+0.204
0.27%
1 jan 1981 ano
74.757
+0.199
0.27%
1 jan 1982 ano
74.951
+0.194
0.26%
1 jan 1983 ano
75.141
+0.189
0.25%
1 jan 1984 ano
75.325
+0.184
0.25%
1 jan 1985 ano
75.506
+0.181
0.24%
1 jan 1986 ano
75.683
+0.176
0.23%
1 jan 1987 ano
75.856
+0.173
0.23%
1 jan 1988 ano
76.025
+0.169
0.22%
1 jan 1989 ano
76.191
+0.166
0.22%
1 jan 1990 ano
76.354
+0.163
0.21%
1 jan 1991 ano
76.514
+0.16
0.21%
1 jan 1992 ano
76.671
+0.157
0.21%
1 jan 1993 ano
76.826
+0.155
0.2%
1 jan 1994 ano
76.978
+0.152
0.2%
1 jan 1995 ano
77.128
+0.149
0.19%
1 jan 1996 ano
77.275
+0.147
0.19%
1 jan 1997 ano
77.419
+0.144
0.19%
1 jan 1998 ano
77.561
+0.142
0.18%
1 jan 1999 ano
77.701
+0.14
0.18%
1 jan 2000 ano
77.838
+0.137
0.18%
1 jan 2001 ano
77.972
+0.134
0.17%
1 jan 2002 ano
78.101
+0.129
0.17%
1 jan 2003 ano
78.224
+0.123
0.16%
1 jan 2004 ano
78.346
+0.122
0.16%
1 jan 2005 ano
78.466
+0.12
0.15%
1 jan 2006 ano
78.59
+0.124
0.16%
1 jan 2007 ano
78.723
+0.133
0.17%
1 jan 2008 ano
78.869
+0.146
0.18%
1 jan 2009 ano
79.028
+0.159
0.2%
1 jan 2010 ano
79.199
+0.172
0.22%
1 jan 2011 ano
79.382
+0.182
0.23%
1 jan 2012 ano
79.572
+0.19
0.24%
1 jan 2013 ano
79.762
+0.191
0.24%
1 jan 2014 ano
79.95
+0.188
0.24%
1 jan 2015 ano
80.132
+0.182
0.23%
Classificação de países por estatísticas atuais por anos


Comentários: