29
/pt/
pt
AIzaSyAYiBZKx7MnpbEhh9jyipgxe19OcubqV5w
April 1, 2024
149342
Haiti
HTI
true
2
1
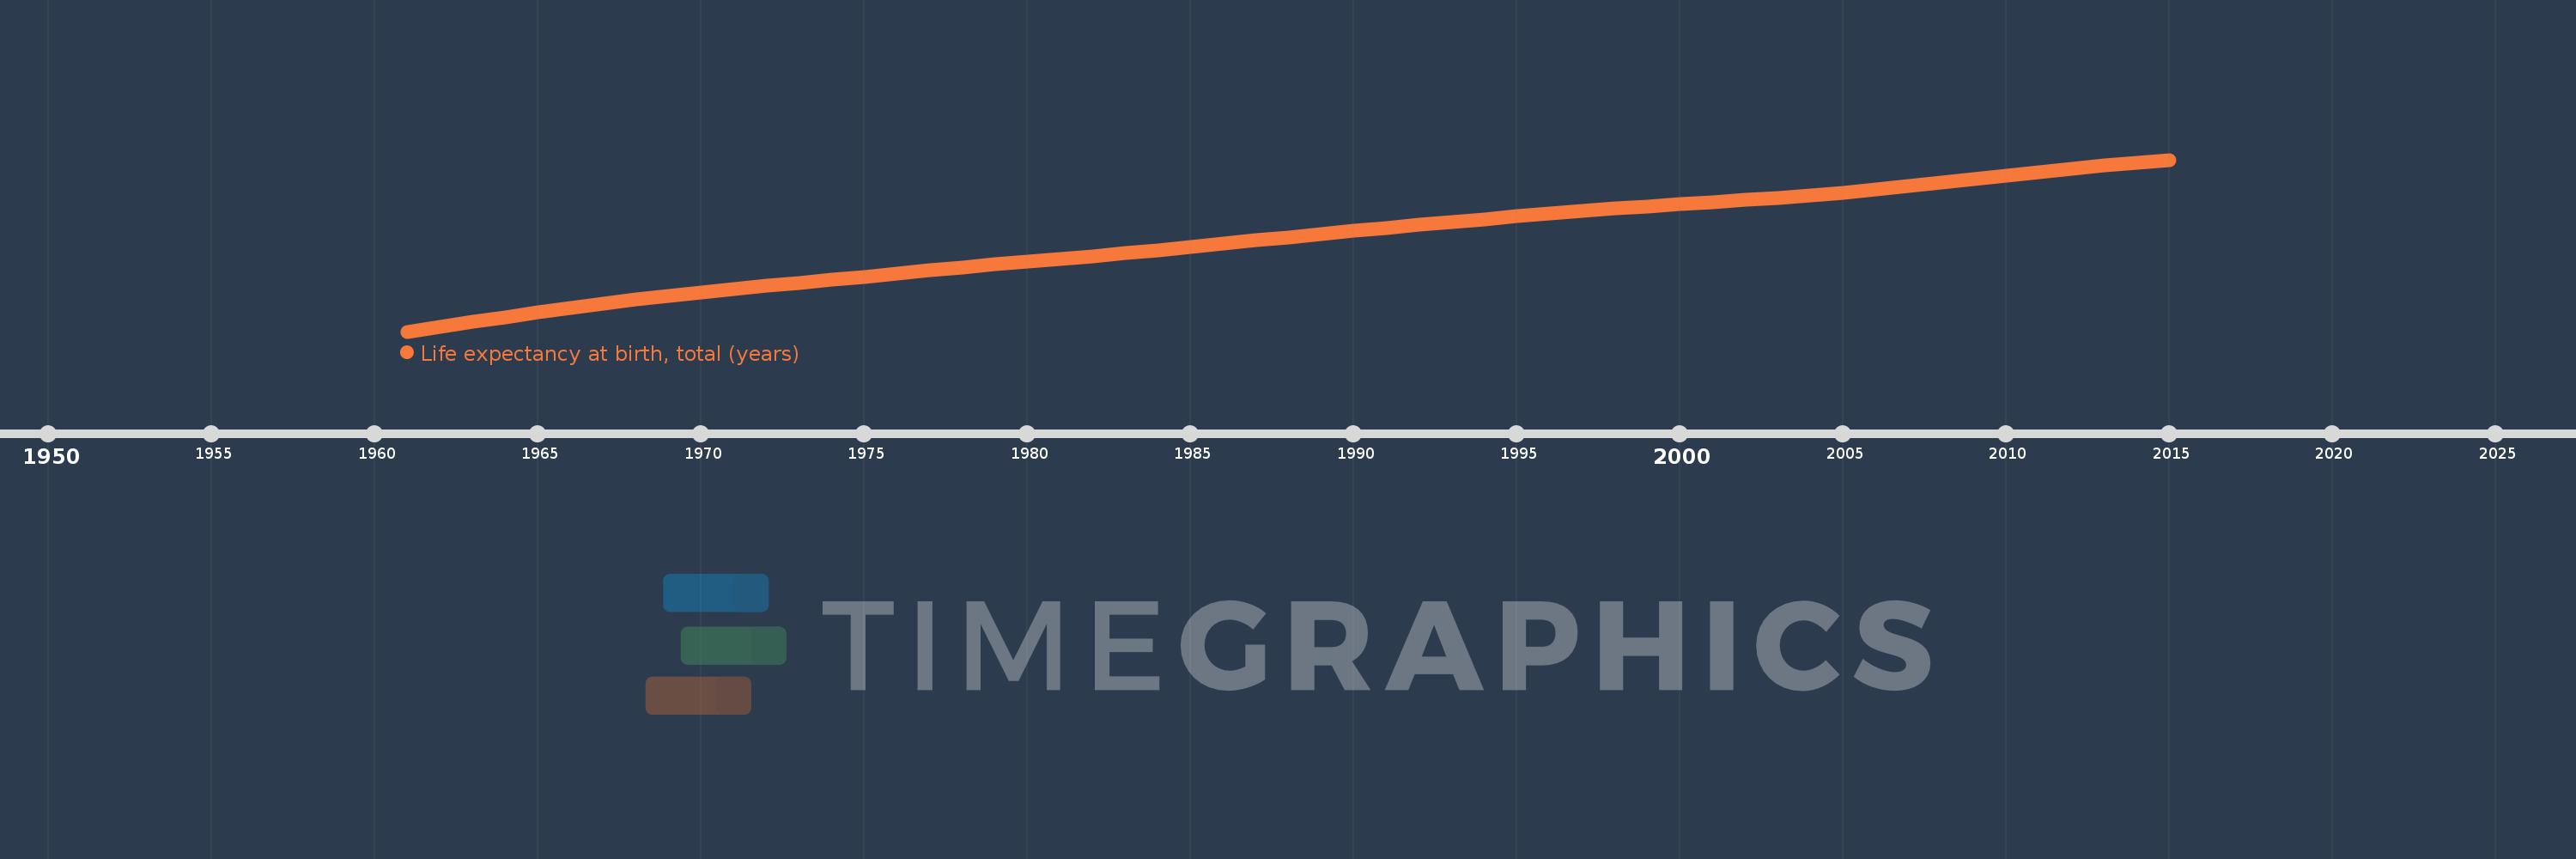
Life expectancy at birth, total (years)
2015,2014,2013,2012,2011,2010,2009,2008,2007,2006,2005,2004,2003,2002,2001,2000,1999,1998,1997,1996,1995,1994,1993,1992,1991,1990,1989,1988,1987,1986,1985,1984,1983,1982,1981,1980,1979,1978,1977,1976,1975,1974,1973,1972,1971,1970,1969,1968,1967,1966,1965,1964,1963,1962,1961
Estas estatísticas em outros países:
AfghanistanAlbaniaAlgeriaAngolaAntigua and BarbudaArab WorldArgentinaArmeniaArubaAustraliaAustriaAzerbaijanBahamas, TheBahrainBangladeshBarbadosBelarusBelgiumBelizeBeninBermudaBhutanBoliviaBosnia and HerzegovinaBotswanaBrazilBrunei DarussalamBulgariaBurkina FasoBurundiCabo VerdeCambodiaCameroonCanadaCaribbean small statesCentral African RepublicCentral Europe and the BalticsChadChannel IslandsChileChinaColombiaComorosCongo, Dem. Rep.Congo, Rep.Costa RicaCote d'IvoireCroatiaCubaCuracaoCyprusCzech RepublicDenmarkDjiboutiDominicaDominican RepublicEarly-demographic dividendEast Asia & PacificEast Asia & Pacific (excluding high income)East Asia & Pacific (IDA & IBRD countries)EcuadorEgypt, Arab Rep.El SalvadorEquatorial GuineaEritreaEstoniaEthiopiaEuro areaEurope & Central AsiaEurope & Central Asia (excluding high income)Europe & Central Asia (IDA & IBRD countries)European UnionFaroe IslandsFijiFinlandFragile and conflict affected situationsFranceFrench PolynesiaGabonGambia, TheGeorgiaGermanyGhanaGreeceGreenlandGrenadaGuamGuatemalaGuineaGuinea-BissauGuyanaHaitiHeavily indebted poor countries (HIPC)High incomeHondurasHong Kong SAR, ChinaHungaryIBRD onlyIcelandIDA & IBRD totalIDA blendIDA onlyIDA totalIndiaIndonesiaIran, Islamic Rep.IraqIrelandIsle of ManIsraelItalyJamaicaJapanJordanKazakhstanKenyaKiribatiKorea, Dem. People’s Rep.Korea, Rep.KosovoKuwaitKyrgyz RepublicLao PDRLate-demographic dividendLatin America & Caribbean Latin America & Caribbean (excluding high income)Latin America & the Caribbean (IDA & IBRD countries)LatviaLeast developed countries: UN classificationLebanonLesothoLiberiaLibyaLiechtensteinLithuaniaLow & middle incomeLow incomeLower middle incomeLuxembourgMacao SAR, ChinaMacedonia, FYRMadagascarMalawiMalaysiaMaldivesMaliMaltaMarshall IslandsMauritaniaMauritiusMexicoMicronesia, Fed. Sts.Middle East & North AfricaMiddle East & North Africa (excluding high income)Middle East & North Africa (IDA & IBRD countries)Middle incomeMoldovaMongoliaMontenegroMoroccoMozambiqueMyanmarNamibiaNepalNetherlandsNew CaledoniaNew ZealandNicaraguaNigerNigeriaNorth AmericaNorwayOECD membersOmanOther small statesPacific island small statesPakistanPalauPanamaPapua New GuineaParaguayPeruPhilippinesPolandPortugalPost-demographic dividendPre-demographic dividendPuerto RicoQatarRomaniaRussian FederationRwandaSamoaSan MarinoSao Tome and PrincipeSaudi ArabiaSenegalSerbiaSeychellesSierra LeoneSingaporeSint Maarten (Dutch part)Slovak RepublicSloveniaSmall statesSolomon IslandsSomaliaSouth AfricaSouth AsiaSouth Asia (IDA & IBRD)South SudanSpainSri LankaSt. Kitts and NevisSt. LuciaSt. Martin (French part)St. Vincent and the GrenadinesSub-Saharan Africa Sub-Saharan Africa (excluding high income)Sub-Saharan Africa (IDA & IBRD countries)SudanSurinameSwazilandSwedenSwitzerlandSyrian Arab RepublicTajikistanTanzaniaThailandTimor-LesteTogoTongaTrinidad and TobagoTunisiaTurkeyTurkmenistanUgandaUkraineUnited Arab EmiratesUnited KingdomUnited StatesUpper middle incomeUruguayUzbekistanVanuatuVenezuela, RBVietnamVirgin Islands (U.S.)West Bank and GazaWorldYemen, Rep.ZambiaZimbabwe Linha do tempo:
Nesta escala de tempo está apresentado um gráfico de 1961 ano até 2015 ano Haiti. Dados de 1960 ano ausente. O número de observações reais por data: 55.
Fonte (nome):
Indicadores de desenvolvimento mundial
Fonte (organização):
Derived from male and female life expectancy at birth from sources such as: (1) United Nations Population Division. World Population Prospects, (2) Census reports and other statistical publications from national statistical offices, (3) Eurostat: Demographic Statistics, (4) United Nations Statistical Division. Population and Vital Statistics Reprot (various years), (5) U.S. Census Bureau: International Database, and (6) Secretariat of the Pacific Community: Statistics and Demography Programme.
Categorias:
Health
Foi atualizado:
23 abr 2017 ano
Indicadores de alterações dos valores ao longo dos anos
Mínimo:
42.1
1 jan 1961 ano
Máximo:
62.747
1 jan 2015 ano
Na data de observação
Valor
Mudança absoluta
A alteração em relação ao valor anterior
1 jan 1961 ano
42.1
+42.1
0.0%
1 jan 1962 ano
42.684
+0.584
1.39%
1 jan 1963 ano
43.264
+0.58
1.36%
1 jan 1964 ano
43.836
+0.572
1.32%
1 jan 1965 ano
44.399
+0.562
1.28%
1 jan 1966 ano
44.942
+0.543
1.22%
1 jan 1967 ano
45.459
+0.517
1.15%
1 jan 1968 ano
45.942
+0.484
1.06%
1 jan 1969 ano
46.391
+0.449
0.98%
1 jan 1970 ano
46.808
+0.417
0.9%
1 jan 1971 ano
47.2
+0.391
0.84%
1 jan 1972 ano
47.577
+0.377
0.8%
1 jan 1973 ano
47.948
+0.372
0.78%
1 jan 1974 ano
48.323
+0.375
0.78%
1 jan 1975 ano
48.704
+0.381
0.79%
1 jan 1976 ano
49.087
+0.383
0.79%
1 jan 1977 ano
49.465
+0.378
0.77%
1 jan 1978 ano
49.828
+0.363
0.73%
1 jan 1979 ano
50.174
+0.346
0.69%
1 jan 1980 ano
50.504
+0.331
0.66%
1 jan 1981 ano
50.828
+0.324
0.64%
1 jan 1982 ano
51.157
+0.329
0.65%
1 jan 1983 ano
51.5
+0.344
0.67%
1 jan 1984 ano
51.864
+0.363
0.71%
1 jan 1985 ano
52.248
+0.384
0.74%
1 jan 1986 ano
52.648
+0.4
0.77%
1 jan 1987 ano
53.054
+0.406
0.77%
1 jan 1988 ano
53.455
+0.401
0.76%
1 jan 1989 ano
53.843
+0.388
0.73%
1 jan 1990 ano
54.214
+0.371
0.69%
1 jan 1991 ano
54.569
+0.356
0.66%
1 jan 1992 ano
54.914
+0.345
0.63%
1 jan 1993 ano
55.256
+0.342
0.62%
1 jan 1994 ano
55.598
+0.343
0.62%
1 jan 1995 ano
55.941
+0.342
0.62%
1 jan 1996 ano
56.276
+0.335
0.6%
1 jan 1997 ano
56.595
+0.319
0.57%
1 jan 1998 ano
56.893
+0.298
0.53%
1 jan 1999 ano
57.169
+0.276
0.49%
1 jan 2000 ano
57.426
+0.257
0.45%
1 jan 2001 ano
57.676
+0.25
0.43%
1 jan 2002 ano
57.93
+0.254
0.44%
1 jan 2003 ano
58.199
+0.27
0.47%
1 jan 2004 ano
58.495
+0.296
0.51%
1 jan 2005 ano
58.821
+0.326
0.56%
1 jan 2006 ano
59.178
+0.358
0.61%
1 jan 2007 ano
59.567
+0.389
0.66%
1 jan 2008 ano
59.977
+0.41
0.69%
1 jan 2009 ano
60.398
+0.421
0.7%
1 jan 2010 ano
60.822
+0.424
0.7%
1 jan 2011 ano
61.24
+0.418
0.69%
1 jan 2012 ano
61.645
+0.405
0.66%
1 jan 2013 ano
62.033
+0.388
0.63%
1 jan 2014 ano
62.401
+0.368
0.59%
1 jan 2015 ano
62.747
+0.346
0.55%
Classificação de países por estatísticas atuais por anos


Comentários: