29
/pt/
pt
AIzaSyAYiBZKx7MnpbEhh9jyipgxe19OcubqV5w
April 1, 2024
89791
Botswana
BWA
true
2
1
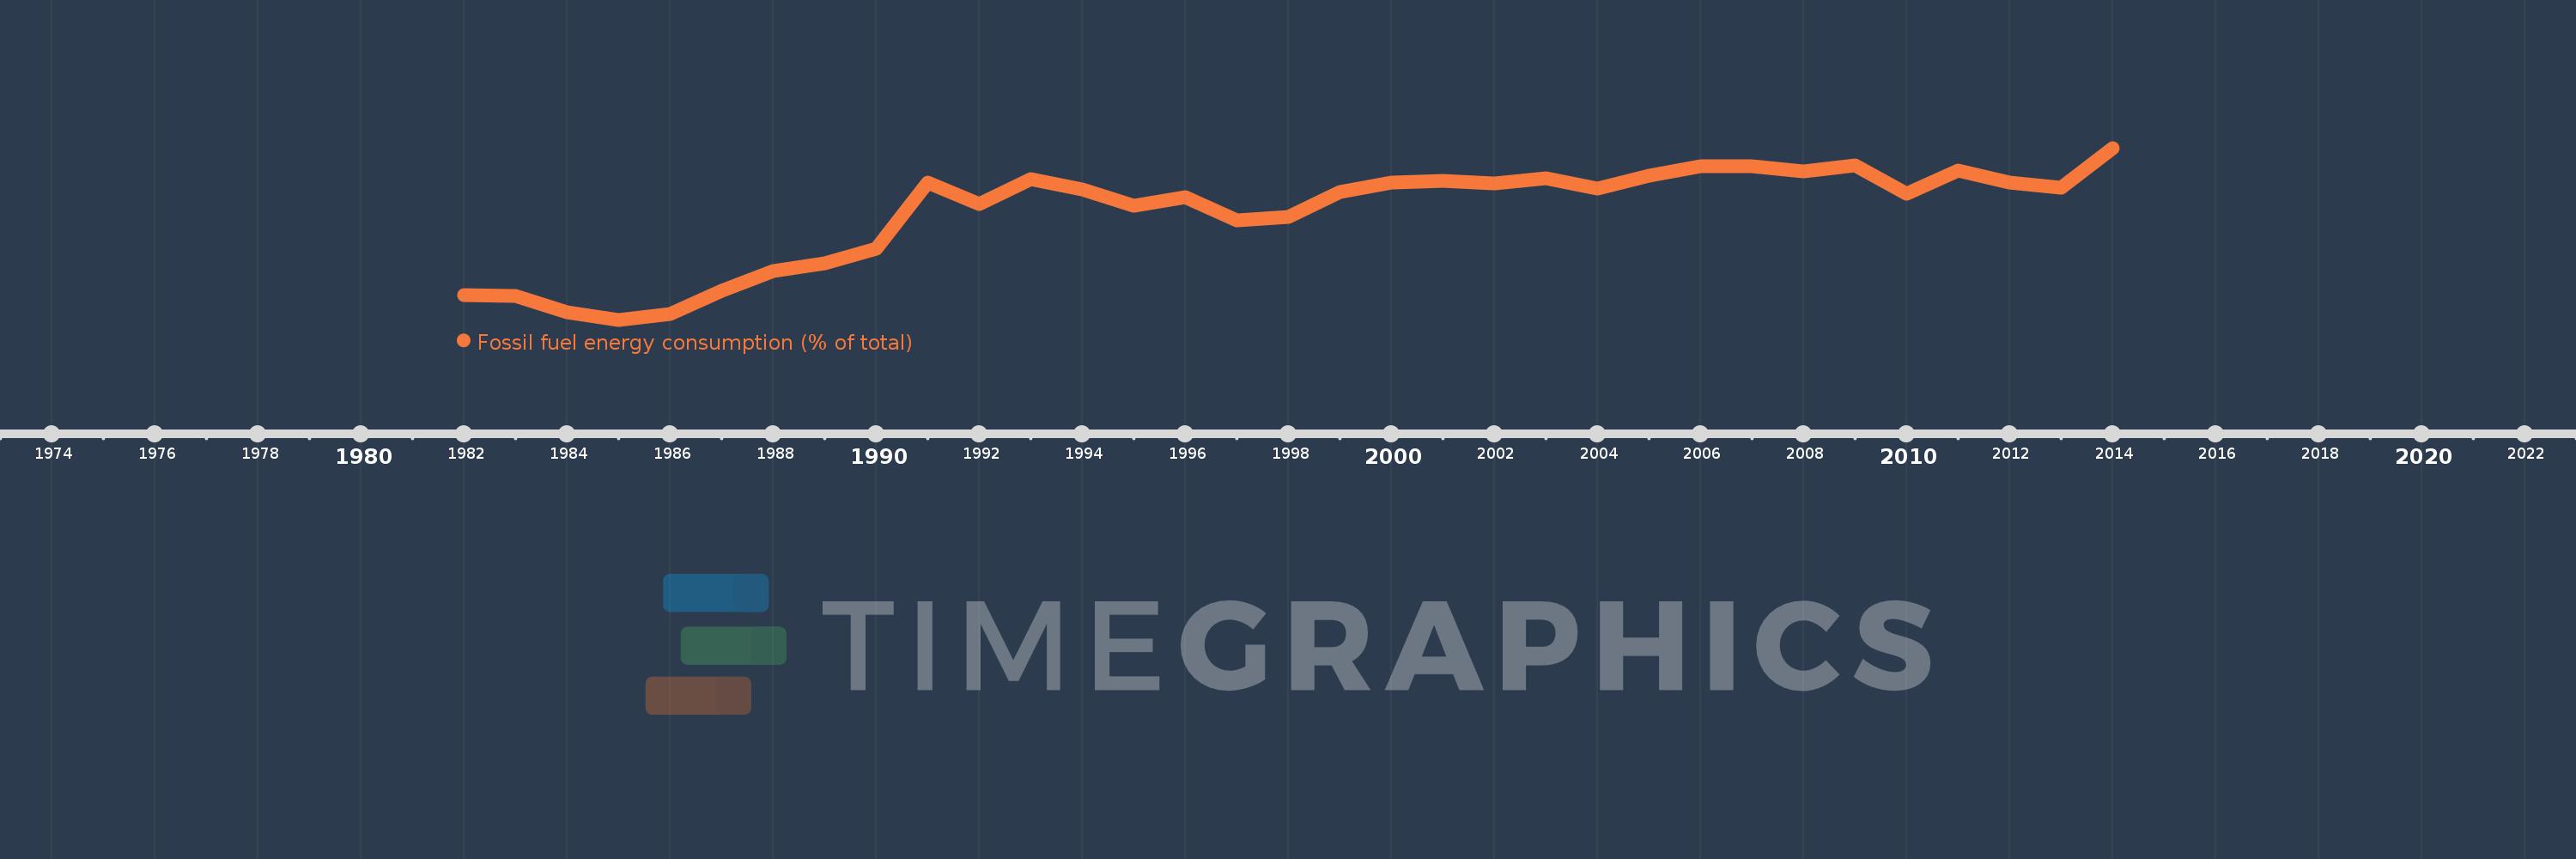
Fossil fuel energy consumption (% of total)
2014,2013,2012,2011,2010,2009,2008,2007,2006,2005,2004,2003,2002,2001,2000,1999,1998,1997,1996,1995,1994,1993,1992,1991,1990,1989,1988,1987,1986,1985,1984,1983,1982
Estas estatísticas em outros países:
AlbaniaAlgeriaAngolaAntigua and BarbudaArab WorldArgentinaArmeniaAustraliaAustriaAzerbaijanBahamas, TheBahrainBangladeshBarbadosBelarusBelgiumBelizeBeninBhutanBoliviaBosnia and HerzegovinaBotswanaBrazilBrunei DarussalamBulgariaCabo VerdeCambodiaCameroonCanadaCaribbean small statesCentral Europe and the BalticsChileChinaColombiaComorosCongo, Dem. Rep.Congo, Rep.Costa RicaCote d'IvoireCroatiaCubaCuracaoCyprusCzech RepublicDenmarkDjiboutiDominicaDominican RepublicEarly-demographic dividendEast Asia & PacificEast Asia & Pacific (excluding high income)East Asia & Pacific (IDA & IBRD countries)EcuadorEgypt, Arab Rep.El SalvadorEquatorial GuineaEritreaEstoniaEthiopiaEuro areaEurope & Central AsiaEurope & Central Asia (excluding high income)Europe & Central Asia (IDA & IBRD countries)European UnionFijiFinlandFragile and conflict affected situationsFranceGabonGambia, TheGeorgiaGermanyGhanaGibraltarGreeceGrenadaGuatemalaGuinea-BissauGuyanaHaitiHeavily indebted poor countries (HIPC)High incomeHondurasHong Kong SAR, ChinaHungaryIBRD onlyIcelandIDA & IBRD totalIDA blendIDA onlyIDA totalIndiaIndonesiaIran, Islamic Rep.IraqIrelandIsraelItalyJamaicaJapanJordanKazakhstanKenyaKiribatiKorea, Dem. People’s Rep.Korea, Rep.KosovoKuwaitKyrgyz RepublicLate-demographic dividendLatin America & Caribbean Latin America & Caribbean (excluding high income)Latin America & the Caribbean (IDA & IBRD countries)LatviaLeast developed countries: UN classificationLebanonLesothoLibyaLithuaniaLow & middle incomeLow incomeLower middle incomeLuxembourgMacedonia, FYRMalaysiaMaldivesMaltaMarshall IslandsMauritiusMexicoMiddle East & North AfricaMiddle East & North Africa (excluding high income)Middle East & North Africa (IDA & IBRD countries)Middle incomeMoldovaMongoliaMontenegroMoroccoMozambiqueMyanmarNamibiaNepalNetherlandsNew ZealandNicaraguaNigerNigeriaNorth AmericaNorwayOECD membersOmanOther small statesPacific island small statesPakistanPalauPanamaParaguayPeruPhilippinesPolandPortugalPost-demographic dividendPre-demographic dividendQatarRomaniaRussian FederationSamoaSao Tome and PrincipeSaudi ArabiaSenegalSerbiaSeychellesSingaporeSlovak RepublicSloveniaSmall statesSolomon IslandsSouth AfricaSouth AsiaSouth Asia (IDA & IBRD)South SudanSpainSri LankaSt. Kitts and NevisSt. LuciaSt. Vincent and the GrenadinesSub-Saharan Africa Sub-Saharan Africa (excluding high income)Sub-Saharan Africa (IDA & IBRD countries)SudanSurinameSwazilandSwedenSwitzerlandSyrian Arab RepublicTajikistanTanzaniaThailandTimor-LesteTogoTongaTrinidad and TobagoTunisiaTurkeyUkraineUnited Arab EmiratesUnited KingdomUnited StatesUpper middle incomeUruguayUzbekistanVanuatuVenezuela, RBVietnamWorldYemen, Rep.ZambiaZimbabwe Linha do tempo:
Nesta escala de tempo está apresentado um gráfico de 1982 ano até 2014 ano Botswana. Dados de 1981 ano ausente. O número de observações reais por data: 33.
Fonte (nome):
Indicadores de desenvolvimento mundial
Fonte (organização):
IEA Statistics © OECD/IEA 2014 (http://www.iea.org/stats/index.asp), subject to https://www.iea.org/t&c/termsandconditions/
Categorias:
Energy & Mining
Foi atualizado:
23 abr 2017 ano
Indicadores de alterações dos valores ao longo dos anos
Mínimo:
47.927
1 jan 1985 ano
Máximo:
69.131
1 jan 2014 ano
Na data de observação
Valor
Mudança absoluta
A alteração em relação ao valor anterior
1 jan 1982 ano
50.977
+50.977
0.0%
1 jan 1983 ano
50.84
-0.138
-0.27%
1 jan 1984 ano
48.823
-2.017
-3.97%
1 jan 1985 ano
47.927
-0.896
-1.84%
1 jan 1986 ano
48.679
+0.752
1.57%
1 jan 1987 ano
51.449
+2.77
5.69%
1 jan 1988 ano
53.934
+2.485
4.83%
1 jan 1989 ano
54.892
+0.957
1.78%
1 jan 1990 ano
56.653
+1.761
3.21%
1 jan 1991 ano
64.834
+8.181
14.44%
1 jan 1992 ano
62.168
-2.667
-4.11%
1 jan 1993 ano
65.31
+3.142
5.05%
1 jan 1994 ano
63.967
-1.343
-2.06%
1 jan 1995 ano
61.955
-2.012
-3.15%
1 jan 1996 ano
63.053
+1.098
1.77%
1 jan 1997 ano
60.172
-2.881
-4.57%
1 jan 1998 ano
60.633
+0.461
0.77%
1 jan 1999 ano
63.701
+3.069
5.06%
1 jan 2000 ano
64.85
+1.149
1.8%
1 jan 2001 ano
65.113
+0.263
0.41%
1 jan 2002 ano
64.784
-0.33
-0.51%
1 jan 2003 ano
65.377
+0.594
0.92%
1 jan 2004 ano
64.145
-1.232
-1.89%
1 jan 2005 ano
65.691
+1.546
2.41%
1 jan 2006 ano
66.832
+1.141
1.74%
1 jan 2007 ano
66.88
+0.048
0.07%
1 jan 2008 ano
66.189
-0.691
-1.03%
1 jan 2009 ano
67.017
+0.828
1.25%
1 jan 2010 ano
63.507
-3.51
-5.24%
1 jan 2011 ano
66.347
+2.84
4.47%
1 jan 2012 ano
64.907
-1.439
-2.17%
1 jan 2013 ano
64.19
-0.718
-1.11%
1 jan 2014 ano
69.131
+4.941
7.7%
Classificação de países por estatísticas atuais por anos


Comentários: