29
/pt/
pt
AIzaSyAYiBZKx7MnpbEhh9jyipgxe19OcubqV5w
April 1, 2024
191391
Malta
MLT
true
2
1
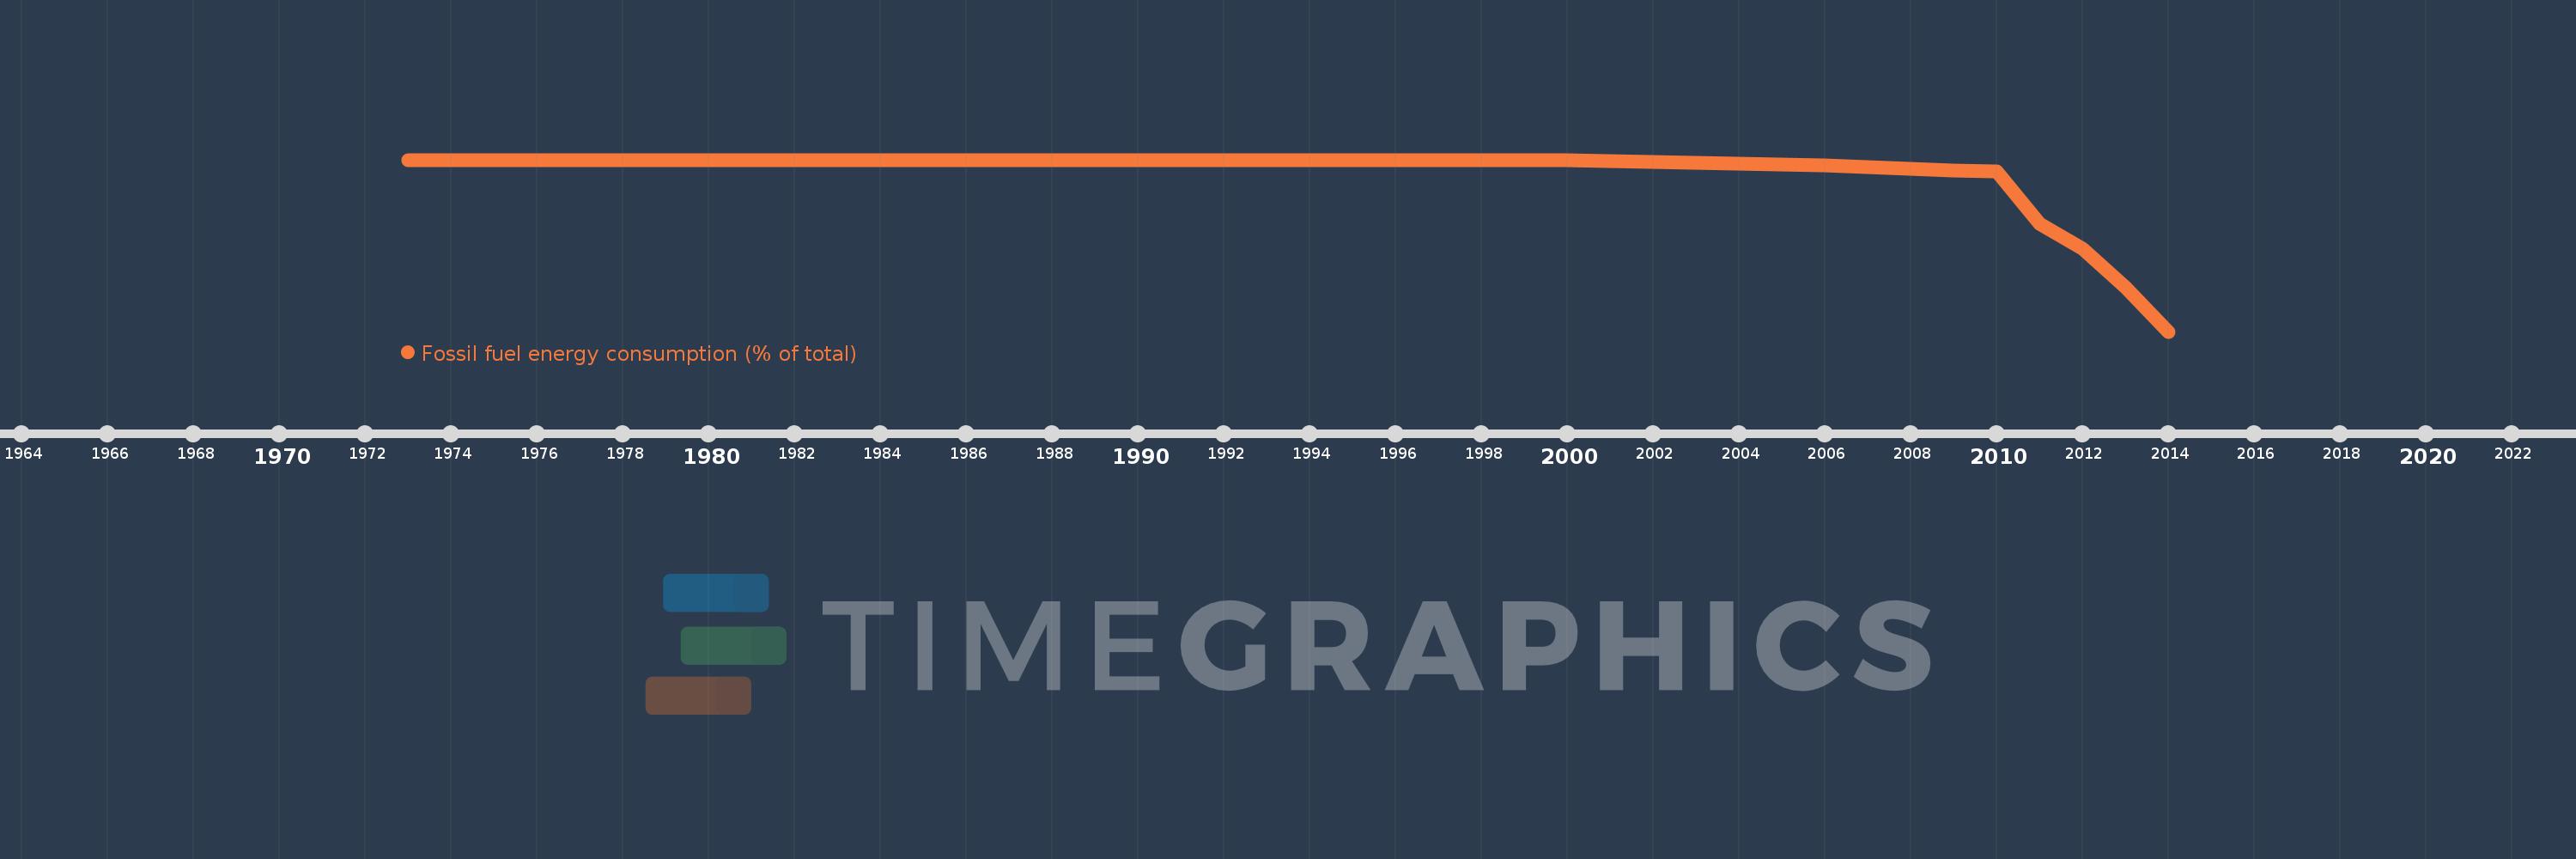
Fossil fuel energy consumption (% of total)
2014,2013,2012,2011,2010,2009,2008,2007,2006,2005,2004,2003,2000,1999,1998,1997,1996,1993,1992,1991,1990,1989,1987,1986,1985,1982,1981,1980,1979,1978,1977,1976,1973
Estas estatísticas em outros países:
AlbaniaAlgeriaAngolaAntigua and BarbudaArab WorldArgentinaArmeniaAustraliaAustriaAzerbaijanBahamas, TheBahrainBangladeshBarbadosBelarusBelgiumBelizeBeninBhutanBoliviaBosnia and HerzegovinaBotswanaBrazilBrunei DarussalamBulgariaCabo VerdeCambodiaCameroonCanadaCaribbean small statesCentral Europe and the BalticsChileChinaColombiaComorosCongo, Dem. Rep.Congo, Rep.Costa RicaCote d'IvoireCroatiaCubaCuracaoCyprusCzech RepublicDenmarkDjiboutiDominicaDominican RepublicEarly-demographic dividendEast Asia & PacificEast Asia & Pacific (excluding high income)East Asia & Pacific (IDA & IBRD countries)EcuadorEgypt, Arab Rep.El SalvadorEquatorial GuineaEritreaEstoniaEthiopiaEuro areaEurope & Central AsiaEurope & Central Asia (excluding high income)Europe & Central Asia (IDA & IBRD countries)European UnionFijiFinlandFragile and conflict affected situationsFranceGabonGambia, TheGeorgiaGermanyGhanaGibraltarGreeceGrenadaGuatemalaGuinea-BissauGuyanaHaitiHeavily indebted poor countries (HIPC)High incomeHondurasHong Kong SAR, ChinaHungaryIBRD onlyIcelandIDA & IBRD totalIDA blendIDA onlyIDA totalIndiaIndonesiaIran, Islamic Rep.IraqIrelandIsraelItalyJamaicaJapanJordanKazakhstanKenyaKiribatiKorea, Dem. People’s Rep.Korea, Rep.KosovoKuwaitKyrgyz RepublicLate-demographic dividendLatin America & Caribbean Latin America & Caribbean (excluding high income)Latin America & the Caribbean (IDA & IBRD countries)LatviaLeast developed countries: UN classificationLebanonLesothoLibyaLithuaniaLow & middle incomeLow incomeLower middle incomeLuxembourgMacedonia, FYRMalaysiaMaldivesMaltaMarshall IslandsMauritiusMexicoMiddle East & North AfricaMiddle East & North Africa (excluding high income)Middle East & North Africa (IDA & IBRD countries)Middle incomeMoldovaMongoliaMontenegroMoroccoMozambiqueMyanmarNamibiaNepalNetherlandsNew ZealandNicaraguaNigerNigeriaNorth AmericaNorwayOECD membersOmanOther small statesPacific island small statesPakistanPalauPanamaParaguayPeruPhilippinesPolandPortugalPost-demographic dividendPre-demographic dividendQatarRomaniaRussian FederationSamoaSao Tome and PrincipeSaudi ArabiaSenegalSerbiaSeychellesSingaporeSlovak RepublicSloveniaSmall statesSolomon IslandsSouth AfricaSouth AsiaSouth Asia (IDA & IBRD)South SudanSpainSri LankaSt. Kitts and NevisSt. LuciaSt. Vincent and the GrenadinesSub-Saharan Africa Sub-Saharan Africa (excluding high income)Sub-Saharan Africa (IDA & IBRD countries)SudanSurinameSwazilandSwedenSwitzerlandSyrian Arab RepublicTajikistanTanzaniaThailandTimor-LesteTogoTongaTrinidad and TobagoTunisiaTurkeyUkraineUnited Arab EmiratesUnited KingdomUnited StatesUpper middle incomeUruguayUzbekistanVanuatuVenezuela, RBVietnamWorldYemen, Rep.ZambiaZimbabwe Linha do tempo:
Nesta escala de tempo está apresentado um gráfico de 1973 ano até 2014 ano Malta. Dados de 1972 ano ausente. O número de observações reais por data: 33.
Fonte (nome):
Indicadores de desenvolvimento mundial
Fonte (organização):
IEA Statistics © OECD/IEA 2014 (http://www.iea.org/stats/index.asp), subject to https://www.iea.org/t&c/termsandconditions/
Categorias:
Energy & Mining
Foi atualizado:
23 abr 2017 ano
Indicadores de alterações dos valores ao longo dos anos
Mínimo:
98.256
1 jan 2014 ano
Máximo:
100.0
1 jan 1973 ano
Na data de observação
Valor
Mudança absoluta
A alteração em relação ao valor anterior
1 jan 1973 ano
100.0
+100.0
0.0%
1 jan 1976 ano
100.0
0.0
0.0%
1 jan 1977 ano
100.0
0.0
0.0%
1 jan 1978 ano
100.0
0.0
0.0%
1 jan 1979 ano
100.0
+0.0
0.0%
1 jan 1980 ano
100.0
0.0
0.0%
1 jan 1981 ano
100.0
+0.0
0.0%
1 jan 1982 ano
100.0
0.0
0.0%
1 jan 1985 ano
100.0
0.0
0.0%
1 jan 1986 ano
100.0
+0.0
0.0%
1 jan 1987 ano
100.0
0.0
0.0%
1 jan 1989 ano
100.0
0.0
0.0%
1 jan 1990 ano
100.0
0.0
0.0%
1 jan 1991 ano
100.0
0.0
0.0%
1 jan 1992 ano
100.0
0.0
0.0%
1 jan 1993 ano
100.0
0.0
0.0%
1 jan 1996 ano
100.0
0.0
0.0%
1 jan 1997 ano
100.0
0.0
0.0%
1 jan 1998 ano
100.0
0.0
0.0%
1 jan 1999 ano
100.0
0.0
0.0%
1 jan 2000 ano
100.0
+0.0
0.0%
1 jan 2003 ano
99.967
-0.033
-0.03%
1 jan 2004 ano
99.962
-0.005
-0.01%
1 jan 2005 ano
99.951
-0.011
-0.01%
1 jan 2006 ano
99.94
-0.011
-0.01%
1 jan 2007 ano
99.922
-0.018
-0.02%
1 jan 2008 ano
99.91
-0.012
-0.01%
1 jan 2009 ano
99.891
-0.019
-0.02%
1 jan 2010 ano
99.88
-0.011
-0.01%
1 jan 2011 ano
99.348
-0.533
-0.53%
1 jan 2012 ano
99.097
-0.251
-0.25%
1 jan 2013 ano
98.704
-0.392
-0.4%
1 jan 2014 ano
98.256
-0.449
-0.45%
Classificação de países por estatísticas atuais por anos


Comentários: