29
/pt/
pt
AIzaSyAYiBZKx7MnpbEhh9jyipgxe19OcubqV5w
April 1, 2024
26505
Early-demographic dividend
EAR
false
2
1
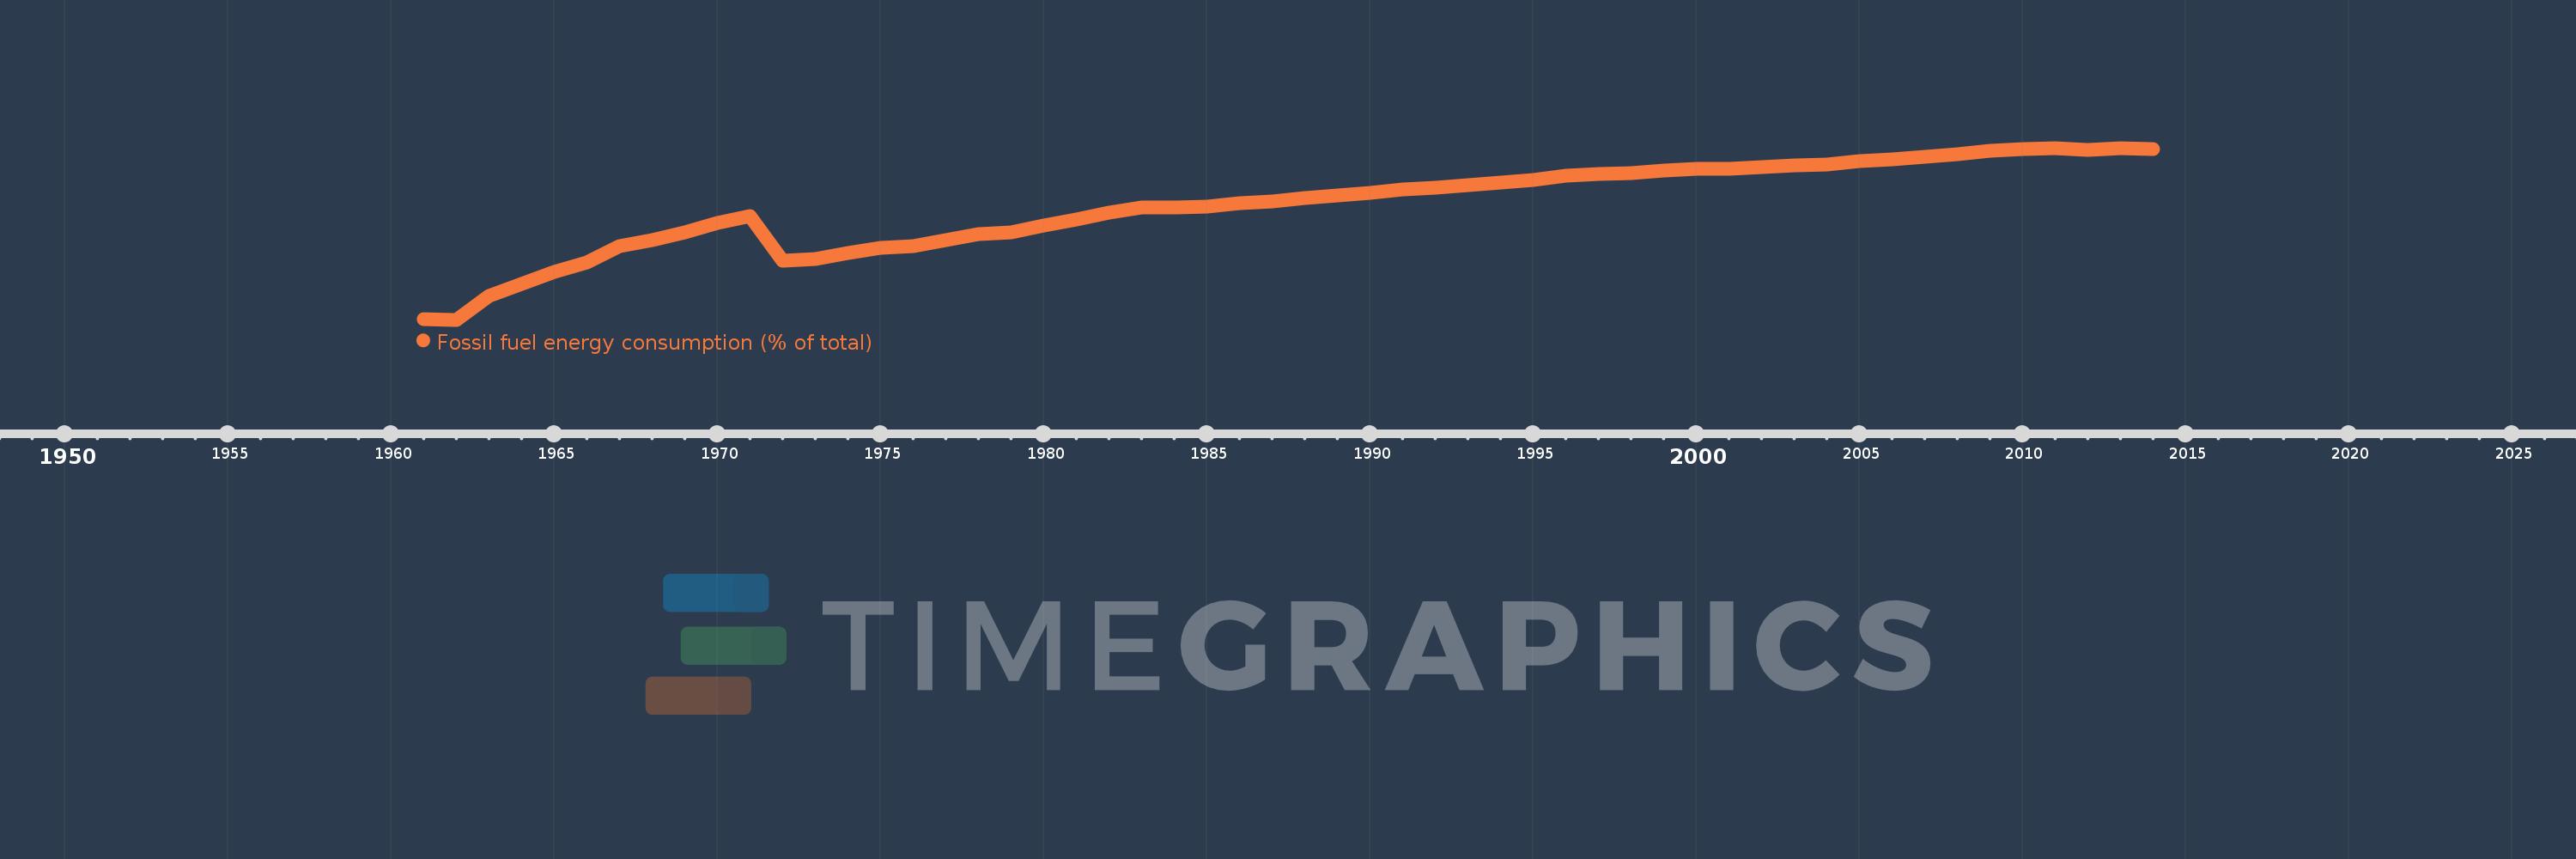
Fossil fuel energy consumption (% of total)
2014,2013,2012,2011,2010,2009,2008,2007,2006,2005,2004,2003,2002,2001,2000,1999,1998,1997,1996,1995,1994,1993,1992,1991,1990,1989,1988,1987,1986,1985,1984,1983,1982,1981,1980,1979,1978,1977,1976,1975,1974,1973,1972,1971,1970,1969,1968,1967,1966,1965,1964,1963,1962,1961
Estas estatísticas em outros países:
AlbaniaAlgeriaAngolaAntigua and BarbudaArab WorldArgentinaArmeniaAustraliaAustriaAzerbaijanBahamas, TheBahrainBangladeshBarbadosBelarusBelgiumBelizeBeninBhutanBoliviaBosnia and HerzegovinaBotswanaBrazilBrunei DarussalamBulgariaCabo VerdeCambodiaCameroonCanadaCaribbean small statesCentral Europe and the BalticsChileChinaColombiaComorosCongo, Dem. Rep.Congo, Rep.Costa RicaCote d'IvoireCroatiaCubaCuracaoCyprusCzech RepublicDenmarkDjiboutiDominicaDominican RepublicEarly-demographic dividendEast Asia & PacificEast Asia & Pacific (excluding high income)East Asia & Pacific (IDA & IBRD countries)EcuadorEgypt, Arab Rep.El SalvadorEquatorial GuineaEritreaEstoniaEthiopiaEuro areaEurope & Central AsiaEurope & Central Asia (excluding high income)Europe & Central Asia (IDA & IBRD countries)European UnionFijiFinlandFragile and conflict affected situationsFranceGabonGambia, TheGeorgiaGermanyGhanaGibraltarGreeceGrenadaGuatemalaGuinea-BissauGuyanaHaitiHeavily indebted poor countries (HIPC)High incomeHondurasHong Kong SAR, ChinaHungaryIBRD onlyIcelandIDA & IBRD totalIDA blendIDA onlyIDA totalIndiaIndonesiaIran, Islamic Rep.IraqIrelandIsraelItalyJamaicaJapanJordanKazakhstanKenyaKiribatiKorea, Dem. People’s Rep.Korea, Rep.KosovoKuwaitKyrgyz RepublicLate-demographic dividendLatin America & Caribbean Latin America & Caribbean (excluding high income)Latin America & the Caribbean (IDA & IBRD countries)LatviaLeast developed countries: UN classificationLebanonLesothoLibyaLithuaniaLow & middle incomeLow incomeLower middle incomeLuxembourgMacedonia, FYRMalaysiaMaldivesMaltaMarshall IslandsMauritiusMexicoMiddle East & North AfricaMiddle East & North Africa (excluding high income)Middle East & North Africa (IDA & IBRD countries)Middle incomeMoldovaMongoliaMontenegroMoroccoMozambiqueMyanmarNamibiaNepalNetherlandsNew ZealandNicaraguaNigerNigeriaNorth AmericaNorwayOECD membersOmanOther small statesPacific island small statesPakistanPalauPanamaParaguayPeruPhilippinesPolandPortugalPost-demographic dividendPre-demographic dividendQatarRomaniaRussian FederationSamoaSao Tome and PrincipeSaudi ArabiaSenegalSerbiaSeychellesSingaporeSlovak RepublicSloveniaSmall statesSolomon IslandsSouth AfricaSouth AsiaSouth Asia (IDA & IBRD)South SudanSpainSri LankaSt. Kitts and NevisSt. LuciaSt. Vincent and the GrenadinesSub-Saharan Africa Sub-Saharan Africa (excluding high income)Sub-Saharan Africa (IDA & IBRD countries)SudanSurinameSwazilandSwedenSwitzerlandSyrian Arab RepublicTajikistanTanzaniaThailandTimor-LesteTogoTongaTrinidad and TobagoTunisiaTurkeyUkraineUnited Arab EmiratesUnited KingdomUnited StatesUpper middle incomeUruguayUzbekistanVanuatuVenezuela, RBVietnamWorldYemen, Rep.ZambiaZimbabwe Linha do tempo:
Nesta escala de tempo está apresentado um gráfico de 1961 ano até 2014 ano Early-demographic dividend. Dados de 1960 ano ausente. O número de observações reais por data: 54.
Fonte (nome):
Indicadores de desenvolvimento mundial
Fonte (organização):
IEA Statistics © OECD/IEA 2014 (http://www.iea.org/stats/index.asp), subject to https://www.iea.org/t&c/termsandconditions/
Categorias:
Energy & Mining
Foi atualizado:
23 abr 2017 ano
Indicadores de alterações dos valores ao longo dos anos
Mínimo:
44.159
1 jan 1962 ano
Máximo:
79.677
1 jan 2013 ano
Na data de observação
Valor
Mudança absoluta
A alteração em relação ao valor anterior
1 jan 1961 ano
44.199
+44.199
0.0%
1 jan 1962 ano
44.159
-0.04
-0.09%
1 jan 1963 ano
49.05
+4.891
11.07%
1 jan 1964 ano
51.626
+2.577
5.25%
1 jan 1965 ano
53.975
+2.349
4.55%
1 jan 1966 ano
56.082
+2.107
3.9%
1 jan 1967 ano
59.449
+3.367
6.0%
1 jan 1968 ano
60.625
+1.175
1.98%
1 jan 1969 ano
62.183
+1.559
2.57%
1 jan 1970 ano
64.161
+1.978
3.18%
1 jan 1971 ano
65.654
+1.493
2.33%
1 jan 1972 ano
56.344
-9.31
-14.18%
1 jan 1973 ano
56.802
+0.458
0.81%
1 jan 1974 ano
57.98
+1.179
2.08%
1 jan 1975 ano
59.035
+1.054
1.82%
1 jan 1976 ano
59.417
+0.382
0.65%
1 jan 1977 ano
60.59
+1.173
1.97%
1 jan 1978 ano
61.788
+1.199
1.98%
1 jan 1979 ano
62.257
+0.469
0.76%
1 jan 1980 ano
63.599
+1.342
2.16%
1 jan 1981 ano
64.911
+1.312
2.06%
1 jan 1982 ano
66.38
+1.469
2.26%
1 jan 1983 ano
67.415
+1.035
1.56%
1 jan 1984 ano
67.309
-0.106
-0.16%
1 jan 1985 ano
67.505
+0.196
0.29%
1 jan 1986 ano
68.214
+0.709
1.05%
1 jan 1987 ano
68.539
+0.324
0.48%
1 jan 1988 ano
69.34
+0.801
1.17%
1 jan 1989 ano
69.866
+0.526
0.76%
1 jan 1990 ano
70.43
+0.564
0.81%
1 jan 1991 ano
71.143
+0.714
1.01%
1 jan 1992 ano
71.506
+0.363
0.51%
1 jan 1993 ano
71.93
+0.424
0.59%
1 jan 1994 ano
72.449
+0.518
0.72%
1 jan 1995 ano
73.138
+0.689
0.95%
1 jan 1996 ano
73.972
+0.835
1.14%
1 jan 1997 ano
74.222
+0.25
0.34%
1 jan 1998 ano
74.562
+0.34
0.46%
1 jan 1999 ano
74.926
+0.364
0.49%
1 jan 2000 ano
75.36
+0.434
0.58%
1 jan 2001 ano
75.429
+0.068
0.09%
1 jan 2002 ano
75.67
+0.241
0.32%
1 jan 2003 ano
76.062
+0.392
0.52%
1 jan 2004 ano
76.278
+0.216
0.28%
1 jan 2005 ano
77.023
+0.746
0.98%
1 jan 2006 ano
77.387
+0.364
0.47%
1 jan 2007 ano
77.904
+0.516
0.67%
1 jan 2008 ano
78.415
+0.512
0.66%
1 jan 2009 ano
79.003
+0.587
0.75%
1 jan 2010 ano
79.364
+0.361
0.46%
1 jan 2011 ano
79.578
+0.214
0.27%
1 jan 2012 ano
79.229
-0.349
-0.44%
1 jan 2013 ano
79.677
+0.449
0.57%
1 jan 2014 ano
79.386
-0.291
-0.37%
Classificação de países por estatísticas atuais por anos


Comentários: