29
/pt/
pt
AIzaSyAYiBZKx7MnpbEhh9jyipgxe19OcubqV5w
April 1, 2024
118898
Denmark
DNK
true
2
1
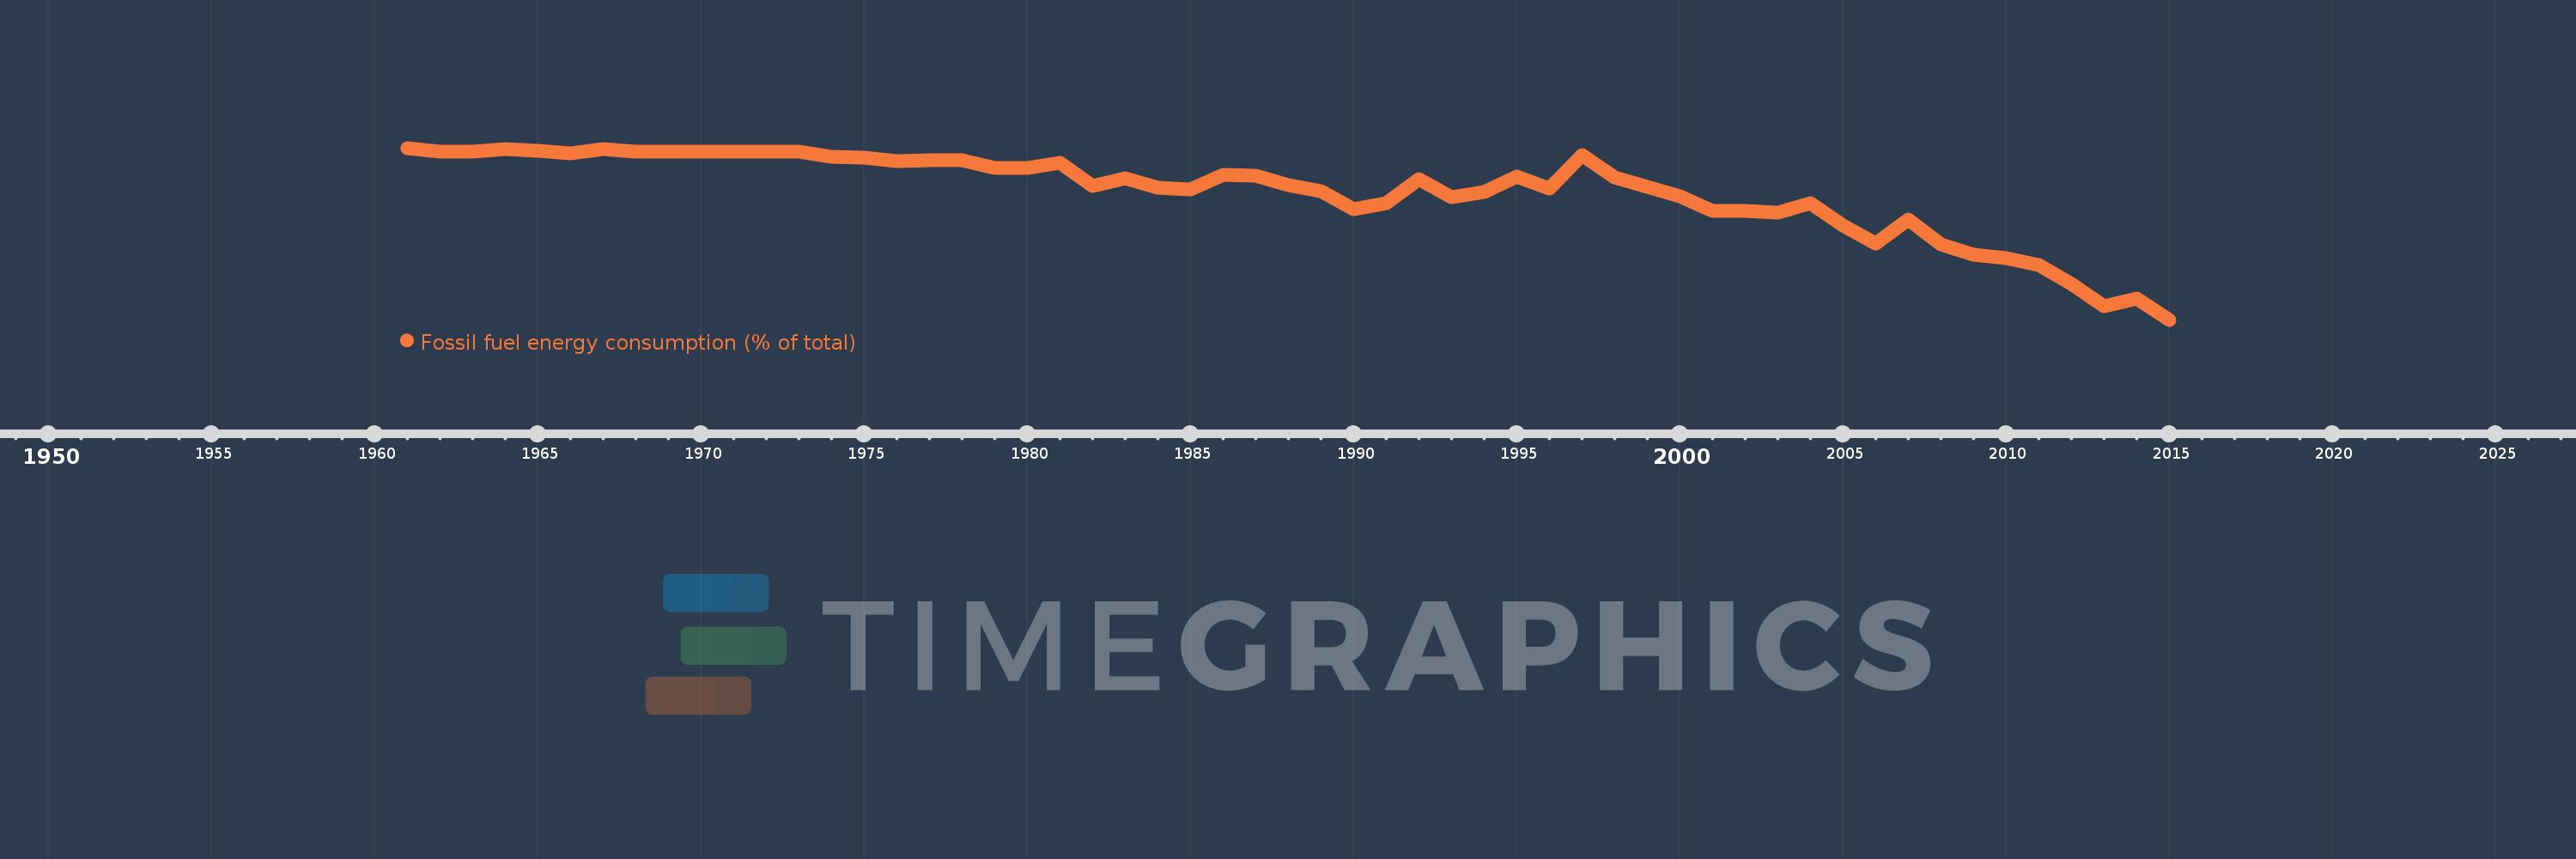
Fossil fuel energy consumption (% of total)
2015,2014,2013,2012,2011,2010,2009,2008,2007,2006,2005,2004,2003,2002,2001,2000,1999,1998,1997,1996,1995,1994,1993,1992,1991,1990,1989,1988,1987,1986,1985,1984,1983,1982,1981,1980,1979,1978,1977,1976,1975,1974,1973,1972,1968,1967,1966,1965,1964,1963,1962,1961
Estas estatísticas em outros países:
AlbaniaAlgeriaAngolaAntigua and BarbudaArab WorldArgentinaArmeniaAustraliaAustriaAzerbaijanBahamas, TheBahrainBangladeshBarbadosBelarusBelgiumBelizeBeninBhutanBoliviaBosnia and HerzegovinaBotswanaBrazilBrunei DarussalamBulgariaCabo VerdeCambodiaCameroonCanadaCaribbean small statesCentral Europe and the BalticsChileChinaColombiaComorosCongo, Dem. Rep.Congo, Rep.Costa RicaCote d'IvoireCroatiaCubaCuracaoCyprusCzech RepublicDenmarkDjiboutiDominicaDominican RepublicEarly-demographic dividendEast Asia & PacificEast Asia & Pacific (excluding high income)East Asia & Pacific (IDA & IBRD countries)EcuadorEgypt, Arab Rep.El SalvadorEquatorial GuineaEritreaEstoniaEthiopiaEuro areaEurope & Central AsiaEurope & Central Asia (excluding high income)Europe & Central Asia (IDA & IBRD countries)European UnionFijiFinlandFragile and conflict affected situationsFranceGabonGambia, TheGeorgiaGermanyGhanaGibraltarGreeceGrenadaGuatemalaGuinea-BissauGuyanaHaitiHeavily indebted poor countries (HIPC)High incomeHondurasHong Kong SAR, ChinaHungaryIBRD onlyIcelandIDA & IBRD totalIDA blendIDA onlyIDA totalIndiaIndonesiaIran, Islamic Rep.IraqIrelandIsraelItalyJamaicaJapanJordanKazakhstanKenyaKiribatiKorea, Dem. People’s Rep.Korea, Rep.KosovoKuwaitKyrgyz RepublicLate-demographic dividendLatin America & Caribbean Latin America & Caribbean (excluding high income)Latin America & the Caribbean (IDA & IBRD countries)LatviaLeast developed countries: UN classificationLebanonLesothoLibyaLithuaniaLow & middle incomeLow incomeLower middle incomeLuxembourgMacedonia, FYRMalaysiaMaldivesMaltaMarshall IslandsMauritiusMexicoMiddle East & North AfricaMiddle East & North Africa (excluding high income)Middle East & North Africa (IDA & IBRD countries)Middle incomeMoldovaMongoliaMontenegroMoroccoMozambiqueMyanmarNamibiaNepalNetherlandsNew ZealandNicaraguaNigerNigeriaNorth AmericaNorwayOECD membersOmanOther small statesPacific island small statesPakistanPalauPanamaParaguayPeruPhilippinesPolandPortugalPost-demographic dividendPre-demographic dividendQatarRomaniaRussian FederationSamoaSao Tome and PrincipeSaudi ArabiaSenegalSerbiaSeychellesSingaporeSlovak RepublicSloveniaSmall statesSolomon IslandsSouth AfricaSouth AsiaSouth Asia (IDA & IBRD)South SudanSpainSri LankaSt. Kitts and NevisSt. LuciaSt. Vincent and the GrenadinesSub-Saharan Africa Sub-Saharan Africa (excluding high income)Sub-Saharan Africa (IDA & IBRD countries)SudanSurinameSwazilandSwedenSwitzerlandSyrian Arab RepublicTajikistanTanzaniaThailandTimor-LesteTogoTongaTrinidad and TobagoTunisiaTurkeyUkraineUnited Arab EmiratesUnited KingdomUnited StatesUpper middle incomeUruguayUzbekistanVanuatuVenezuela, RBVietnamWorldYemen, Rep.ZambiaZimbabwe Linha do tempo:
Nesta escala de tempo está apresentado um gráfico de 1961 ano até 2015 ano Denmark. Dados de 1960 ano ausente. O número de observações reais por data: 52.
Fonte (nome):
Indicadores de desenvolvimento mundial
Fonte (organização):
IEA Statistics © OECD/IEA 2014 (http://www.iea.org/stats/index.asp), subject to https://www.iea.org/t&c/termsandconditions/
Categorias:
Energy & Mining
Foi atualizado:
23 abr 2017 ano
Indicadores de alterações dos valores ao longo dos anos
Mínimo:
68.135
1 jan 2015 ano
Máximo:
99.874
1 jan 1961 ano
Na data de observação
Valor
Mudança absoluta
A alteração em relação ao valor anterior
1 jan 1961 ano
99.874
+99.874
0.0%
1 jan 1962 ano
99.162
-0.712
-0.71%
1 jan 1963 ano
99.258
+0.096
0.1%
1 jan 1964 ano
99.665
+0.407
0.41%
1 jan 1965 ano
99.409
-0.256
-0.26%
1 jan 1966 ano
98.873
-0.536
-0.54%
1 jan 1967 ano
99.628
+0.755
0.76%
1 jan 1968 ano
99.236
-0.392
-0.39%
1 jan 1972 ano
99.132
-0.104
-0.1%
1 jan 1973 ano
99.162
+0.03
0.03%
1 jan 1974 ano
98.225
-0.937
-0.95%
1 jan 1975 ano
98.016
-0.209
-0.21%
1 jan 1976 ano
97.41
-0.606
-0.62%
1 jan 1977 ano
97.529
+0.119
0.12%
1 jan 1978 ano
97.675
+0.146
0.15%
1 jan 1979 ano
96.215
-1.46
-1.49%
1 jan 1980 ano
96.117
-0.098
-0.1%
1 jan 1981 ano
97.167
+1.05
1.09%
1 jan 1982 ano
92.804
-4.363
-4.49%
1 jan 1983 ano
94.281
+1.477
1.59%
1 jan 1984 ano
92.571
-1.711
-1.81%
1 jan 1985 ano
92.224
-0.346
-0.37%
1 jan 1986 ano
94.915
+2.691
2.92%
1 jan 1987 ano
94.757
-0.158
-0.17%
1 jan 1988 ano
93.049
-1.707
-1.8%
1 jan 1989 ano
91.832
-1.218
-1.31%
1 jan 1990 ano
88.613
-3.218
-3.5%
1 jan 1991 ano
89.591
+0.977
1.1%
1 jan 1992 ano
94.084
+4.494
5.02%
1 jan 1993 ano
90.725
-3.36
-3.57%
1 jan 1994 ano
91.757
+1.032
1.14%
1 jan 1995 ano
94.638
+2.881
3.14%
1 jan 1996 ano
92.363
-2.275
-2.4%
1 jan 1997 ano
98.526
+6.163
6.67%
1 jan 1998 ano
94.367
-4.16
-4.22%
1 jan 1999 ano
92.677
-1.69
-1.79%
1 jan 2000 ano
90.893
-1.784
-1.92%
1 jan 2001 ano
88.28
-2.613
-2.87%
1 jan 2002 ano
88.271
-0.009
-0.01%
1 jan 2003 ano
87.99
-0.281
-0.32%
1 jan 2004 ano
89.68
+1.69
1.92%
1 jan 2005 ano
85.475
-4.205
-4.69%
1 jan 2006 ano
82.187
-3.287
-3.85%
1 jan 2007 ano
86.637
+4.449
5.41%
1 jan 2008 ano
82.037
-4.6
-5.31%
1 jan 2009 ano
80.131
-1.905
-2.32%
1 jan 2010 ano
79.576
-0.556
-0.69%
1 jan 2011 ano
78.274
-1.302
-1.64%
1 jan 2012 ano
74.822
-3.452
-4.41%
1 jan 2013 ano
70.688
-4.135
-5.53%
1 jan 2014 ano
72.036
+1.348
1.91%
1 jan 2015 ano
68.135
-3.901
-5.42%
Classificação de países por estatísticas atuais por anos


Comentários: