29
/pt/
pt
AIzaSyAYiBZKx7MnpbEhh9jyipgxe19OcubqV5w
April 1, 2024
135513
Gabon
GAB
true
2
1
Fossil fuel energy consumption (% of total)
2014,2013,2012,2011,2010,2009,2008,2007,2006,2005,2004,2003,2002,2001,2000,1999,1998,1997,1996,1995,1994,1993,1992,1991,1990,1989,1988,1987,1986,1985,1984,1983,1982,1981,1980,1979,1978,1977,1976,1975,1974,1973,1972
Estas estatísticas em outros países:
AlbaniaAlgeriaAngolaAntigua and BarbudaArab WorldArgentinaArmeniaAustraliaAustriaAzerbaijanBahamas, TheBahrainBangladeshBarbadosBelarusBelgiumBelizeBeninBhutanBoliviaBosnia and HerzegovinaBotswanaBrazilBrunei DarussalamBulgariaCabo VerdeCambodiaCameroonCanadaCaribbean small statesCentral Europe and the BalticsChileChinaColombiaComorosCongo, Dem. Rep.Congo, Rep.Costa RicaCote d'IvoireCroatiaCubaCuracaoCyprusCzech RepublicDenmarkDjiboutiDominicaDominican RepublicEarly-demographic dividendEast Asia & PacificEast Asia & Pacific (excluding high income)East Asia & Pacific (IDA & IBRD countries)EcuadorEgypt, Arab Rep.El SalvadorEquatorial GuineaEritreaEstoniaEthiopiaEuro areaEurope & Central AsiaEurope & Central Asia (excluding high income)Europe & Central Asia (IDA & IBRD countries)European UnionFijiFinlandFragile and conflict affected situationsFranceGabonGambia, TheGeorgiaGermanyGhanaGibraltarGreeceGrenadaGuatemalaGuinea-BissauGuyanaHaitiHeavily indebted poor countries (HIPC)High incomeHondurasHong Kong SAR, ChinaHungaryIBRD onlyIcelandIDA & IBRD totalIDA blendIDA onlyIDA totalIndiaIndonesiaIran, Islamic Rep.IraqIrelandIsraelItalyJamaicaJapanJordanKazakhstanKenyaKiribatiKorea, Dem. People’s Rep.Korea, Rep.KosovoKuwaitKyrgyz RepublicLate-demographic dividendLatin America & Caribbean Latin America & Caribbean (excluding high income)Latin America & the Caribbean (IDA & IBRD countries)LatviaLeast developed countries: UN classificationLebanonLesothoLibyaLithuaniaLow & middle incomeLow incomeLower middle incomeLuxembourgMacedonia, FYRMalaysiaMaldivesMaltaMarshall IslandsMauritiusMexicoMiddle East & North AfricaMiddle East & North Africa (excluding high income)Middle East & North Africa (IDA & IBRD countries)Middle incomeMoldovaMongoliaMontenegroMoroccoMozambiqueMyanmarNamibiaNepalNetherlandsNew ZealandNicaraguaNigerNigeriaNorth AmericaNorwayOECD membersOmanOther small statesPacific island small statesPakistanPalauPanamaParaguayPeruPhilippinesPolandPortugalPost-demographic dividendPre-demographic dividendQatarRomaniaRussian FederationSamoaSao Tome and PrincipeSaudi ArabiaSenegalSerbiaSeychellesSingaporeSlovak RepublicSloveniaSmall statesSolomon IslandsSouth AfricaSouth AsiaSouth Asia (IDA & IBRD)South SudanSpainSri LankaSt. Kitts and NevisSt. LuciaSt. Vincent and the GrenadinesSub-Saharan Africa Sub-Saharan Africa (excluding high income)Sub-Saharan Africa (IDA & IBRD countries)SudanSurinameSwazilandSwedenSwitzerlandSyrian Arab RepublicTajikistanTanzaniaThailandTimor-LesteTogoTongaTrinidad and TobagoTunisiaTurkeyUkraineUnited Arab EmiratesUnited KingdomUnited StatesUpper middle incomeUruguayUzbekistanVanuatuVenezuela, RBVietnamWorldYemen, Rep.ZambiaZimbabwe Linha do tempo:
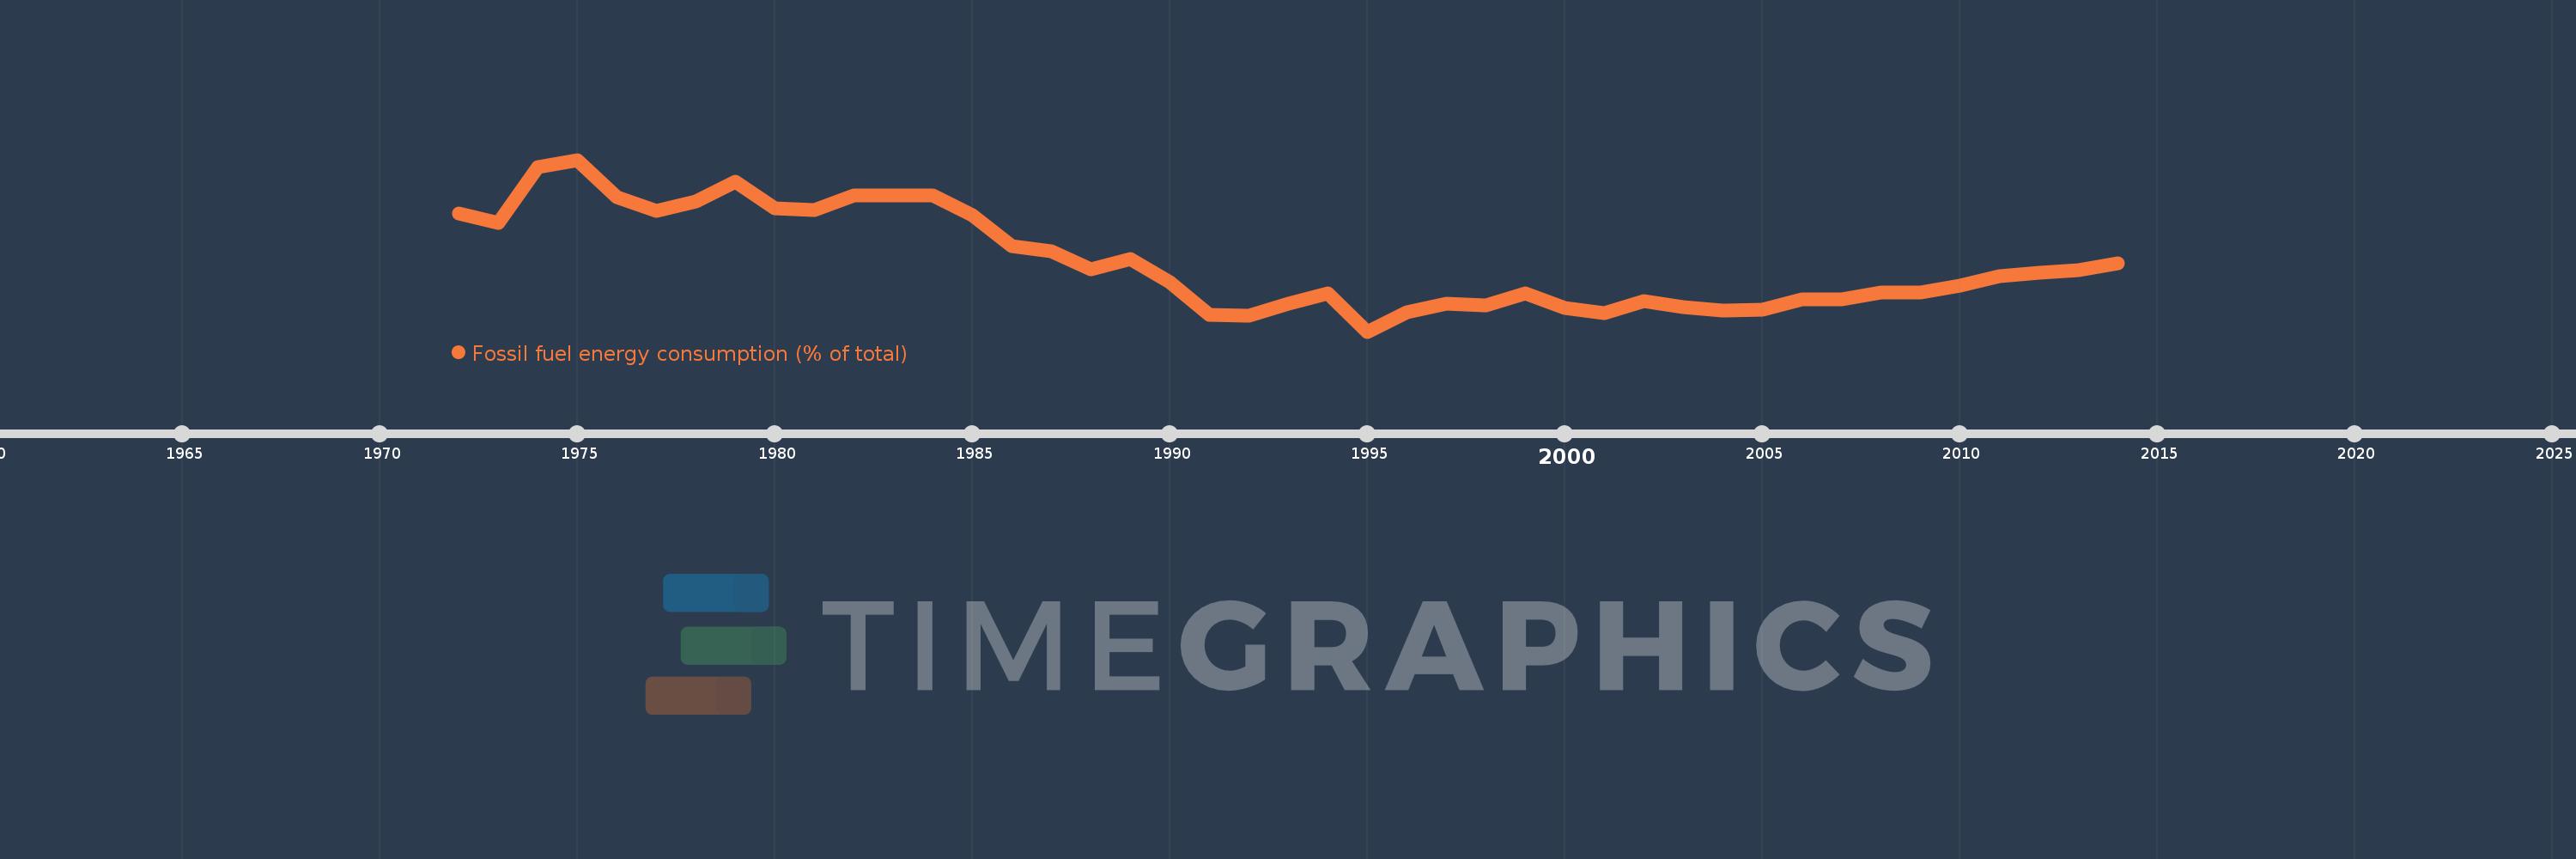
Nesta escala de tempo está apresentado um gráfico de 1972 ano até 2014 ano Gabon. Dados de 1971 ano ausente. O número de observações reais por data: 43.
Fonte (nome):
Indicadores de desenvolvimento mundial
Fonte (organização):
IEA Statistics © OECD/IEA 2014 (http://www.iea.org/stats/index.asp), subject to https://www.iea.org/t&c/termsandconditions/
Categorias:
Energy & Mining
Foi atualizado:
23 abr 2017 ano
Indicadores de alterações dos valores ao longo dos anos
Mínimo:
28.37
1 jan 1995 ano
Máximo:
66.427
1 jan 1975 ano
Na data de observação
Valor
Mudança absoluta
A alteração em relação ao valor anterior
1 jan 1972 ano
54.563
+54.563
0.0%
1 jan 1973 ano
52.514
-2.049
-3.76%
1 jan 1974 ano
64.762
+12.248
23.32%
1 jan 1975 ano
66.427
+1.666
2.57%
1 jan 1976 ano
58.062
-8.366
-12.59%
1 jan 1977 ano
55.153
-2.908
-5.01%
1 jan 1978 ano
57.155
+2.002
3.63%
1 jan 1979 ano
61.547
+4.392
7.68%
1 jan 1980 ano
55.59
-5.957
-9.68%
1 jan 1981 ano
55.348
-0.242
-0.44%
1 jan 1982 ano
58.531
+3.183
5.75%
1 jan 1983 ano
58.46
-0.071
-0.12%
1 jan 1984 ano
58.48
+0.02
0.03%
1 jan 1985 ano
54.083
-4.397
-7.52%
1 jan 1986 ano
47.274
-6.809
-12.59%
1 jan 1987 ano
46.151
-1.123
-2.37%
1 jan 1988 ano
42.252
-3.899
-8.45%
1 jan 1989 ano
44.359
+2.106
4.99%
1 jan 1990 ano
39.396
-4.963
-11.19%
1 jan 1991 ano
32.011
-7.385
-18.74%
1 jan 1992 ano
31.9
-0.111
-0.35%
1 jan 1993 ano
34.48
+2.58
8.09%
1 jan 1994 ano
36.758
+2.278
6.61%
1 jan 1995 ano
28.37
-8.388
-22.82%
1 jan 1996 ano
32.61
+4.241
14.95%
1 jan 1997 ano
34.514
+1.904
5.84%
1 jan 1998 ano
34.236
-0.279
-0.81%
1 jan 1999 ano
36.779
+2.543
7.43%
1 jan 2000 ano
33.555
-3.224
-8.77%
1 jan 2001 ano
32.431
-1.124
-3.35%
1 jan 2002 ano
35.182
+2.751
8.48%
1 jan 2003 ano
33.763
-1.42
-4.04%
1 jan 2004 ano
33.027
-0.735
-2.18%
1 jan 2005 ano
33.253
+0.226
0.68%
1 jan 2006 ano
35.517
+2.264
6.81%
1 jan 2007 ano
35.495
-0.022
-0.06%
1 jan 2008 ano
37.101
+1.606
4.52%
1 jan 2009 ano
37.029
-0.072
-0.19%
1 jan 2010 ano
38.485
+1.456
3.93%
1 jan 2011 ano
40.711
+2.226
5.78%
1 jan 2012 ano
41.383
+0.672
1.65%
1 jan 2013 ano
41.999
+0.616
1.49%
1 jan 2014 ano
43.414
+1.416
3.37%
Classificação de países por estatísticas atuais por anos


Comentários: