29
/pt/
pt
AIzaSyAYiBZKx7MnpbEhh9jyipgxe19OcubqV5w
April 1, 2024
124790
Egypt, Arab Rep.
EGY
true
2
1
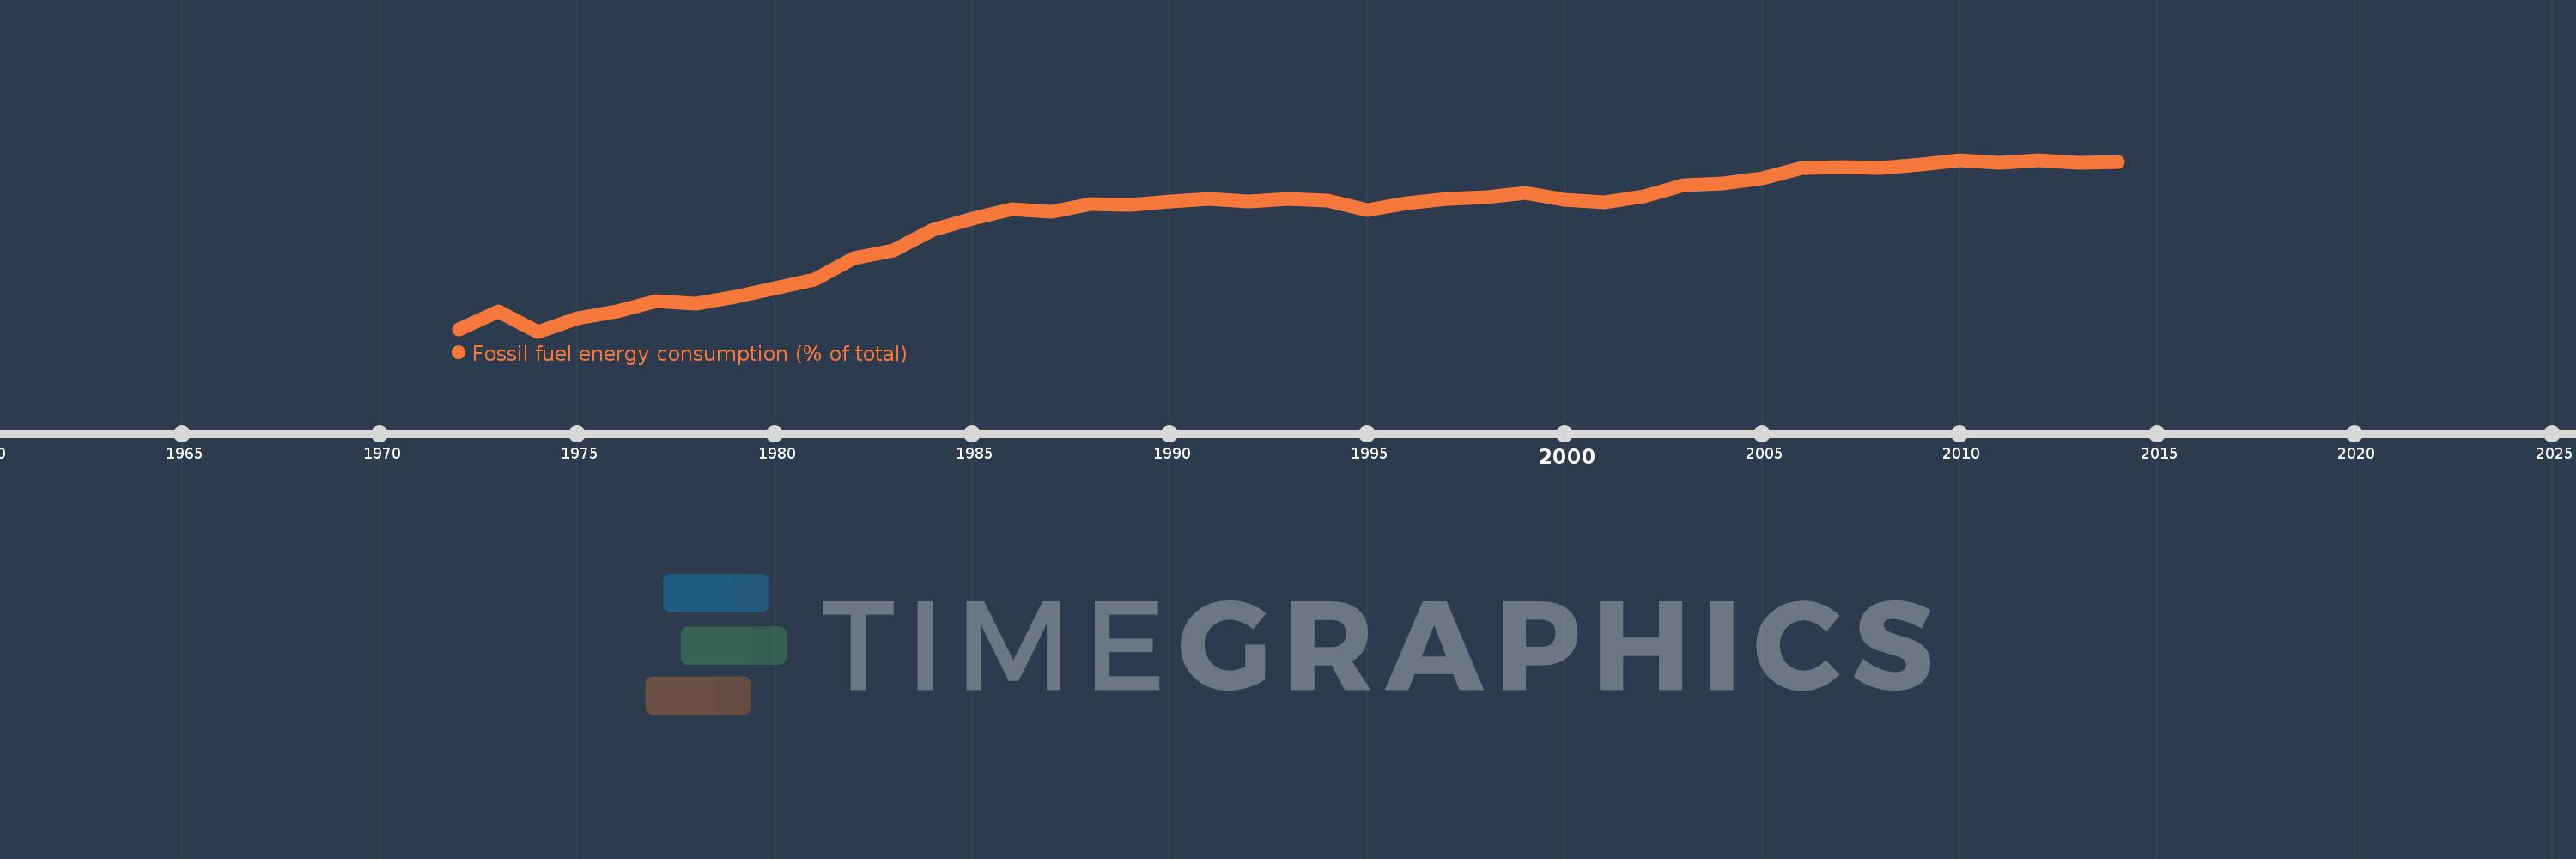
Fossil fuel energy consumption (% of total)
2014,2013,2012,2011,2010,2009,2008,2007,2006,2005,2004,2003,2002,2001,2000,1999,1998,1997,1996,1995,1994,1993,1992,1991,1990,1989,1988,1987,1986,1985,1984,1983,1982,1981,1980,1979,1978,1977,1976,1975,1974,1973,1972
Estas estatísticas em outros países:
AlbaniaAlgeriaAngolaAntigua and BarbudaArab WorldArgentinaArmeniaAustraliaAustriaAzerbaijanBahamas, TheBahrainBangladeshBarbadosBelarusBelgiumBelizeBeninBhutanBoliviaBosnia and HerzegovinaBotswanaBrazilBrunei DarussalamBulgariaCabo VerdeCambodiaCameroonCanadaCaribbean small statesCentral Europe and the BalticsChileChinaColombiaComorosCongo, Dem. Rep.Congo, Rep.Costa RicaCote d'IvoireCroatiaCubaCuracaoCyprusCzech RepublicDenmarkDjiboutiDominicaDominican RepublicEarly-demographic dividendEast Asia & PacificEast Asia & Pacific (excluding high income)East Asia & Pacific (IDA & IBRD countries)EcuadorEgypt, Arab Rep.El SalvadorEquatorial GuineaEritreaEstoniaEthiopiaEuro areaEurope & Central AsiaEurope & Central Asia (excluding high income)Europe & Central Asia (IDA & IBRD countries)European UnionFijiFinlandFragile and conflict affected situationsFranceGabonGambia, TheGeorgiaGermanyGhanaGibraltarGreeceGrenadaGuatemalaGuinea-BissauGuyanaHaitiHeavily indebted poor countries (HIPC)High incomeHondurasHong Kong SAR, ChinaHungaryIBRD onlyIcelandIDA & IBRD totalIDA blendIDA onlyIDA totalIndiaIndonesiaIran, Islamic Rep.IraqIrelandIsraelItalyJamaicaJapanJordanKazakhstanKenyaKiribatiKorea, Dem. People’s Rep.Korea, Rep.KosovoKuwaitKyrgyz RepublicLate-demographic dividendLatin America & Caribbean Latin America & Caribbean (excluding high income)Latin America & the Caribbean (IDA & IBRD countries)LatviaLeast developed countries: UN classificationLebanonLesothoLibyaLithuaniaLow & middle incomeLow incomeLower middle incomeLuxembourgMacedonia, FYRMalaysiaMaldivesMaltaMarshall IslandsMauritiusMexicoMiddle East & North AfricaMiddle East & North Africa (excluding high income)Middle East & North Africa (IDA & IBRD countries)Middle incomeMoldovaMongoliaMontenegroMoroccoMozambiqueMyanmarNamibiaNepalNetherlandsNew ZealandNicaraguaNigerNigeriaNorth AmericaNorwayOECD membersOmanOther small statesPacific island small statesPakistanPalauPanamaParaguayPeruPhilippinesPolandPortugalPost-demographic dividendPre-demographic dividendQatarRomaniaRussian FederationSamoaSao Tome and PrincipeSaudi ArabiaSenegalSerbiaSeychellesSingaporeSlovak RepublicSloveniaSmall statesSolomon IslandsSouth AfricaSouth AsiaSouth Asia (IDA & IBRD)South SudanSpainSri LankaSt. Kitts and NevisSt. LuciaSt. Vincent and the GrenadinesSub-Saharan Africa Sub-Saharan Africa (excluding high income)Sub-Saharan Africa (IDA & IBRD countries)SudanSurinameSwazilandSwedenSwitzerlandSyrian Arab RepublicTajikistanTanzaniaThailandTimor-LesteTogoTongaTrinidad and TobagoTunisiaTurkeyUkraineUnited Arab EmiratesUnited KingdomUnited StatesUpper middle incomeUruguayUzbekistanVanuatuVenezuela, RBVietnamWorldYemen, Rep.ZambiaZimbabwe Linha do tempo:
Nesta escala de tempo está apresentado um gráfico de 1972 ano até 2014 ano Egypt, Arab Rep.. Dados de 1971 ano ausente. O número de observações reais por data: 43.
Fonte (nome):
Indicadores de desenvolvimento mundial
Fonte (organização):
IEA Statistics © OECD/IEA 2014 (http://www.iea.org/stats/index.asp), subject to https://www.iea.org/t&c/termsandconditions/
Categorias:
Energy & Mining
Foi atualizado:
23 abr 2017 ano
Indicadores de alterações dos valores ao longo dos anos
Mínimo:
85.961
1 jan 1974 ano
Máximo:
96.458
1 jan 2012 ano
Na data de observação
Valor
Mudança absoluta
A alteração em relação ao valor anterior
1 jan 1972 ano
86.083
+86.083
0.0%
1 jan 1973 ano
87.173
+1.09
1.27%
1 jan 1974 ano
85.961
-1.212
-1.39%
1 jan 1975 ano
86.755
+0.794
0.92%
1 jan 1976 ano
87.194
+0.439
0.51%
1 jan 1977 ano
87.804
+0.61
0.7%
1 jan 1978 ano
87.658
-0.146
-0.17%
1 jan 1979 ano
88.074
+0.417
0.48%
1 jan 1980 ano
88.632
+0.558
0.63%
1 jan 1981 ano
89.156
+0.524
0.59%
1 jan 1982 ano
90.442
+1.286
1.44%
1 jan 1983 ano
90.92
+0.479
0.53%
1 jan 1984 ano
92.158
+1.238
1.36%
1 jan 1985 ano
92.841
+0.682
0.74%
1 jan 1986 ano
93.418
+0.577
0.62%
1 jan 1987 ano
93.263
-0.155
-0.17%
1 jan 1988 ano
93.74
+0.477
0.51%
1 jan 1989 ano
93.694
-0.047
-0.05%
1 jan 1990 ano
93.899
+0.205
0.22%
1 jan 1991 ano
94.073
+0.175
0.19%
1 jan 1992 ano
93.888
-0.185
-0.2%
1 jan 1993 ano
94.047
+0.159
0.17%
1 jan 1994 ano
93.962
-0.086
-0.09%
1 jan 1995 ano
93.384
-0.577
-0.61%
1 jan 1996 ano
93.816
+0.432
0.46%
1 jan 1997 ano
94.077
+0.261
0.28%
1 jan 1998 ano
94.158
+0.081
0.09%
1 jan 1999 ano
94.447
+0.289
0.31%
1 jan 2000 ano
94.018
-0.43
-0.45%
1 jan 2001 ano
93.882
-0.136
-0.15%
1 jan 2002 ano
94.23
+0.349
0.37%
1 jan 2003 ano
94.884
+0.653
0.69%
1 jan 2004 ano
94.993
+0.109
0.11%
1 jan 2005 ano
95.324
+0.331
0.35%
1 jan 2006 ano
95.956
+0.632
0.66%
1 jan 2007 ano
96.033
+0.077
0.08%
1 jan 2008 ano
95.942
-0.091
-0.1%
1 jan 2009 ano
96.187
+0.245
0.26%
1 jan 2010 ano
96.43
+0.243
0.25%
1 jan 2011 ano
96.295
-0.134
-0.14%
1 jan 2012 ano
96.458
+0.163
0.17%
1 jan 2013 ano
96.292
-0.166
-0.17%
1 jan 2014 ano
96.35
+0.058
0.06%
Classificação de países por estatísticas atuais por anos


Comentários: