29
/pt/
pt
AIzaSyAYiBZKx7MnpbEhh9jyipgxe19OcubqV5w
April 1, 2024
87224
Bolivia
BOL
true
2
1
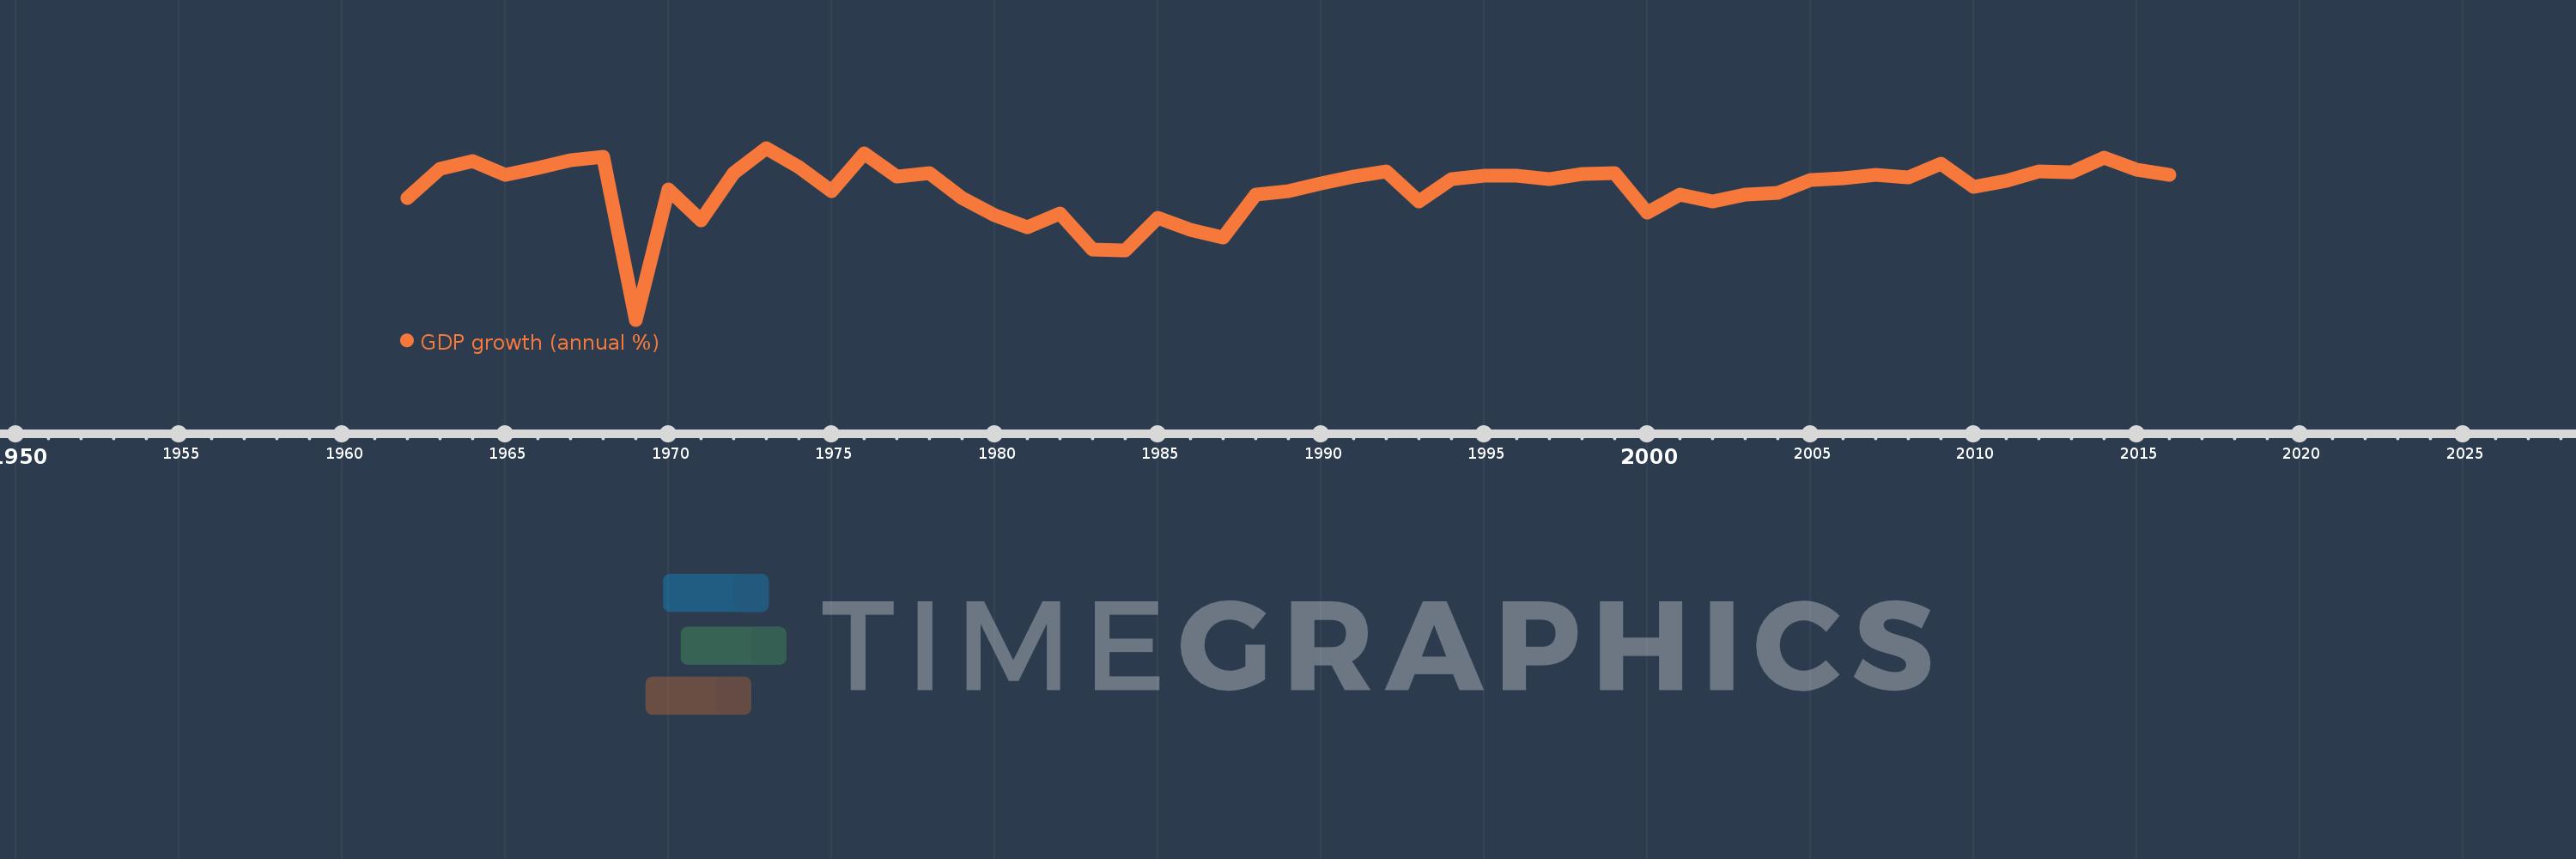
GDP growth (annual %)
2016,2015,2014,2013,2012,2011,2010,2009,2008,2007,2006,2005,2004,2003,2002,2001,2000,1999,1998,1997,1996,1995,1994,1993,1992,1991,1990,1989,1988,1987,1986,1985,1984,1983,1982,1981,1980,1979,1978,1977,1976,1975,1974,1973,1972,1971,1970,1969,1968,1967,1966,1965,1964,1963,1962
Estas estatísticas em outros países:
AfghanistanAlbaniaAlgeriaAndorraAngolaAntigua and BarbudaArab WorldArgentinaArmeniaArubaAustraliaAustriaAzerbaijanBahamas, TheBahrainBangladeshBarbadosBelarusBelgiumBelizeBeninBermudaBhutanBoliviaBosnia and HerzegovinaBotswanaBrazilBrunei DarussalamBulgariaBurkina FasoBurundiCabo VerdeCambodiaCameroonCanadaCaribbean small statesCayman IslandsCentral African RepublicCentral Europe and the BalticsChadChannel IslandsChileChinaColombiaComorosCongo, Dem. Rep.Congo, Rep.Costa RicaCote d'IvoireCroatiaCubaCyprusCzech RepublicDenmarkDjiboutiDominicaDominican RepublicEarly-demographic dividendEast Asia & PacificEast Asia & Pacific (excluding high income)East Asia & Pacific (IDA & IBRD countries)EcuadorEgypt, Arab Rep.El SalvadorEquatorial GuineaEritreaEstoniaEthiopiaEuro areaEurope & Central AsiaEurope & Central Asia (excluding high income)Europe & Central Asia (IDA & IBRD countries)European UnionFijiFinlandFragile and conflict affected situationsFranceFrench PolynesiaGabonGambia, TheGeorgiaGermanyGhanaGreeceGreenlandGrenadaGuatemalaGuineaGuinea-BissauGuyanaHaitiHeavily indebted poor countries (HIPC)High incomeHondurasHong Kong SAR, ChinaHungaryIBRD onlyIcelandIDA & IBRD totalIDA blendIDA onlyIDA totalIndiaIndonesiaIran, Islamic Rep.IraqIrelandIsle of ManIsraelItalyJamaicaJapanJordanKazakhstanKenyaKiribatiKorea, Rep.KosovoKuwaitKyrgyz RepublicLao PDRLate-demographic dividendLatin America & Caribbean Latin America & Caribbean (excluding high income)Latin America & the Caribbean (IDA & IBRD countries)LatviaLeast developed countries: UN classificationLebanonLesothoLiberiaLibyaLiechtensteinLithuaniaLow & middle incomeLow incomeLower middle incomeLuxembourgMacao SAR, ChinaMacedonia, FYRMadagascarMalawiMalaysiaMaldivesMaliMaltaMarshall IslandsMauritaniaMauritiusMexicoMicronesia, Fed. Sts.Middle East & North AfricaMiddle East & North Africa (excluding high income)Middle East & North Africa (IDA & IBRD countries)Middle incomeMoldovaMonacoMongoliaMontenegroMoroccoMozambiqueMyanmarNamibiaNauruNepalNetherlandsNew CaledoniaNew ZealandNicaraguaNigerNigeriaNorth AmericaNorwayOECD membersOmanOther small statesPacific island small statesPakistanPalauPanamaPapua New GuineaParaguayPeruPhilippinesPolandPortugalPost-demographic dividendPre-demographic dividendPuerto RicoQatarRomaniaRussian FederationRwandaSamoaSan MarinoSao Tome and PrincipeSaudi ArabiaSenegalSerbiaSeychellesSierra LeoneSingaporeSlovak RepublicSloveniaSmall statesSolomon IslandsSomaliaSouth AfricaSouth AsiaSouth Asia (IDA & IBRD)South SudanSpainSri LankaSt. Kitts and NevisSt. LuciaSt. Vincent and the GrenadinesSub-Saharan Africa Sub-Saharan Africa (excluding high income)Sub-Saharan Africa (IDA & IBRD countries)SudanSurinameSwazilandSwedenSwitzerlandSyrian Arab RepublicTajikistanTanzaniaThailandTimor-LesteTogoTongaTrinidad and TobagoTunisiaTurkeyTurkmenistanTuvaluUgandaUkraineUnited Arab EmiratesUnited KingdomUnited StatesUpper middle incomeUruguayUzbekistanVanuatuVenezuela, RBVietnamVirgin Islands (U.S.)West Bank and GazaWorldYemen, Rep.ZambiaZimbabwe Linha do tempo:
Nesta escala de tempo está apresentado um gráfico de 1962 ano até 2016 ano Bolivia. Dados de 1961 ano ausente. O número de observações reais por data: 55.
Fonte (nome):
Indicadores de desenvolvimento mundial
Fonte (organização):
World Bank national accounts data, and OECD National Accounts data files.
Categorias:
Economy & Growth
Foi atualizado:
23 abr 2017 ano
Indicadores de alterações dos valores ao longo dos anos
Mínimo:
-12.169
1 jan 1969 ano
Máximo:
7.967
1 jan 1973 ano
Na data de observação
Valor
Mudança absoluta
A alteração em relação ao valor anterior
1 jan 1962 ano
2.08
+2.08
0.0%
1 jan 1963 ano
5.57
+3.49
167.8%
1 jan 1964 ano
6.421
+0.85
15.27%
1 jan 1965 ano
4.795
-1.626
-25.33%
1 jan 1966 ano
5.625
+0.83
17.32%
1 jan 1967 ano
6.497
+0.872
15.51%
1 jan 1968 ano
6.909
+0.412
6.33%
1 jan 1969 ano
-12.169
-19.078
-276.14%
1 jan 1970 ano
3.096
+15.265
-125.44%
1 jan 1971 ano
-0.495
-3.591
-115.98%
1 jan 1972 ano
5.063
+5.558
-1.12 mil%
1 jan 1973 ano
7.967
+2.904
57.36%
1 jan 1974 ano
5.739
-2.228
-27.97%
1 jan 1975 ano
2.94
-2.8
-48.78%
1 jan 1976 ano
7.311
+4.371
148.71%
1 jan 1977 ano
4.615
-2.696
-36.88%
1 jan 1978 ano
4.971
+0.357
7.73%
1 jan 1979 ano
2.053
-2.919
-58.71%
1 jan 1980 ano
0.133
-1.919
-93.5%
1 jan 1981 ano
-1.372
-1.505
-1.13 mil%
1 jan 1982 ano
0.276
+1.647
-120.09%
1 jan 1983 ano
-3.939
-4.214
-1.53 mil%
1 jan 1984 ano
-4.042
-0.103
2.62%
1 jan 1985 ano
-0.201
+3.841
-95.04%
1 jan 1986 ano
-1.676
-1.476
735.39%
1 jan 1987 ano
-2.574
-0.897
53.54%
1 jan 1988 ano
2.463
+5.037
-195.71%
1 jan 1989 ano
2.91
+0.446
18.11%
1 jan 1990 ano
3.79
+0.881
30.27%
1 jan 1991 ano
4.636
+0.846
22.31%
1 jan 1992 ano
5.267
+0.631
13.61%
1 jan 1993 ano
1.647
-3.62
-68.74%
1 jan 1994 ano
4.269
+2.623
159.3%
1 jan 1995 ano
4.667
+0.398
9.32%
1 jan 1996 ano
4.678
+0.011
0.24%
1 jan 1997 ano
4.361
-0.317
-6.77%
1 jan 1998 ano
4.954
+0.593
13.59%
1 jan 1999 ano
5.029
+0.075
1.52%
1 jan 2000 ano
0.427
-4.602
-91.51%
1 jan 2001 ano
2.508
+2.081
487.47%
1 jan 2002 ano
1.684
-0.824
-32.86%
1 jan 2003 ano
2.486
+0.802
47.62%
1 jan 2004 ano
2.711
+0.226
9.08%
1 jan 2005 ano
4.173
+1.462
53.92%
1 jan 2006 ano
4.421
+0.248
5.95%
1 jan 2007 ano
4.797
+0.376
8.49%
1 jan 2008 ano
4.564
-0.233
-4.85%
1 jan 2009 ano
6.149
+1.585
34.72%
1 jan 2010 ano
3.356
-2.794
-45.43%
1 jan 2011 ano
4.129
+0.773
23.04%
1 jan 2012 ano
5.202
+1.073
25.99%
1 jan 2013 ano
5.122
-0.079
-1.52%
1 jan 2014 ano
6.799
+1.676
32.72%
1 jan 2015 ano
5.459
-1.34
-19.7%
1 jan 2016 ano
4.849
-0.61
-11.18%
Classificação de países por estatísticas atuais por anos


Comentários: