29
/pt/
pt
AIzaSyAYiBZKx7MnpbEhh9jyipgxe19OcubqV5w
April 1, 2024
107243
Colombia
COL
true
2
1
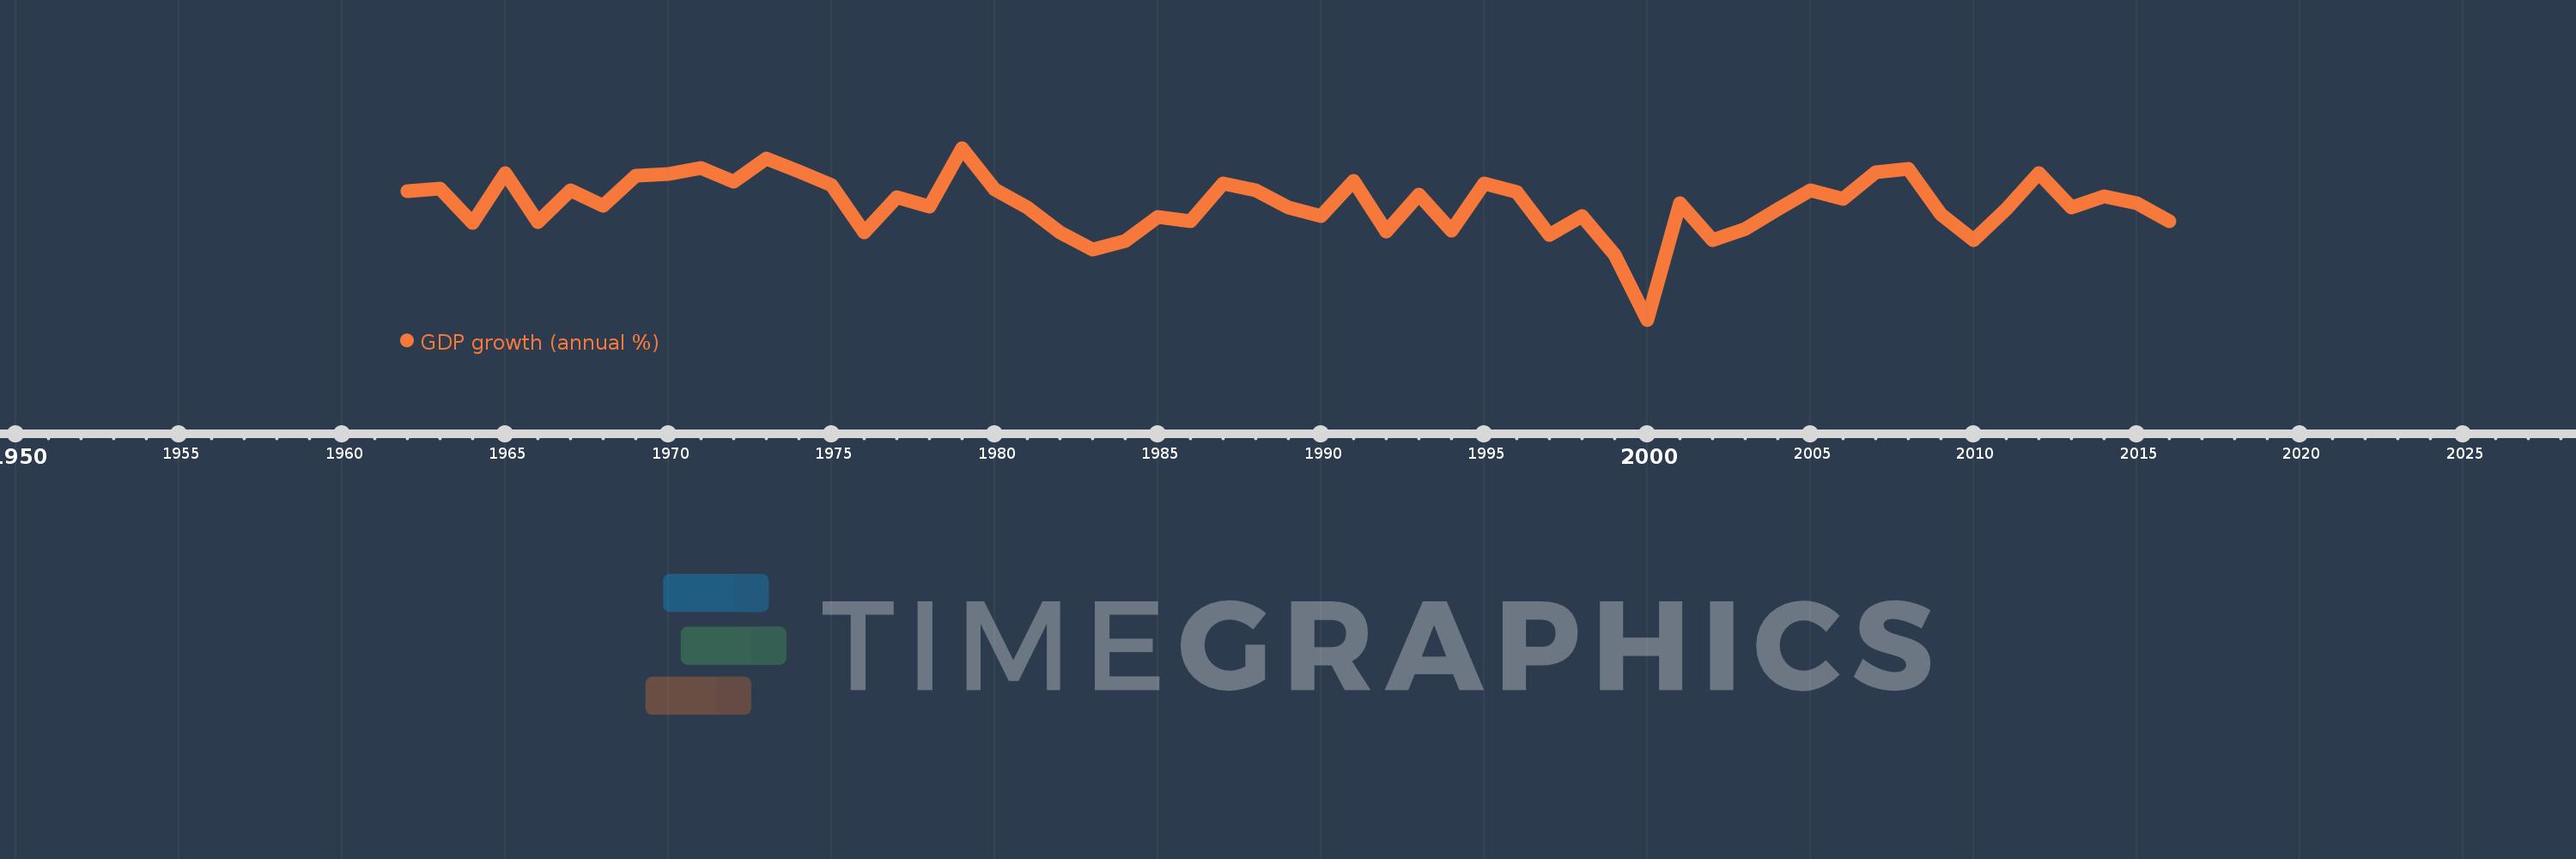
GDP growth (annual %)
2016,2015,2014,2013,2012,2011,2010,2009,2008,2007,2006,2005,2004,2003,2002,2001,2000,1999,1998,1997,1996,1995,1994,1993,1992,1991,1990,1989,1988,1987,1986,1985,1984,1983,1982,1981,1980,1979,1978,1977,1976,1975,1974,1973,1972,1971,1970,1969,1968,1967,1966,1965,1964,1963,1962
Estas estatísticas em outros países:
AfghanistanAlbaniaAlgeriaAndorraAngolaAntigua and BarbudaArab WorldArgentinaArmeniaArubaAustraliaAustriaAzerbaijanBahamas, TheBahrainBangladeshBarbadosBelarusBelgiumBelizeBeninBermudaBhutanBoliviaBosnia and HerzegovinaBotswanaBrazilBrunei DarussalamBulgariaBurkina FasoBurundiCabo VerdeCambodiaCameroonCanadaCaribbean small statesCayman IslandsCentral African RepublicCentral Europe and the BalticsChadChannel IslandsChileChinaColombiaComorosCongo, Dem. Rep.Congo, Rep.Costa RicaCote d'IvoireCroatiaCubaCyprusCzech RepublicDenmarkDjiboutiDominicaDominican RepublicEarly-demographic dividendEast Asia & PacificEast Asia & Pacific (excluding high income)East Asia & Pacific (IDA & IBRD countries)EcuadorEgypt, Arab Rep.El SalvadorEquatorial GuineaEritreaEstoniaEthiopiaEuro areaEurope & Central AsiaEurope & Central Asia (excluding high income)Europe & Central Asia (IDA & IBRD countries)European UnionFijiFinlandFragile and conflict affected situationsFranceFrench PolynesiaGabonGambia, TheGeorgiaGermanyGhanaGreeceGreenlandGrenadaGuatemalaGuineaGuinea-BissauGuyanaHaitiHeavily indebted poor countries (HIPC)High incomeHondurasHong Kong SAR, ChinaHungaryIBRD onlyIcelandIDA & IBRD totalIDA blendIDA onlyIDA totalIndiaIndonesiaIran, Islamic Rep.IraqIrelandIsle of ManIsraelItalyJamaicaJapanJordanKazakhstanKenyaKiribatiKorea, Rep.KosovoKuwaitKyrgyz RepublicLao PDRLate-demographic dividendLatin America & Caribbean Latin America & Caribbean (excluding high income)Latin America & the Caribbean (IDA & IBRD countries)LatviaLeast developed countries: UN classificationLebanonLesothoLiberiaLibyaLiechtensteinLithuaniaLow & middle incomeLow incomeLower middle incomeLuxembourgMacao SAR, ChinaMacedonia, FYRMadagascarMalawiMalaysiaMaldivesMaliMaltaMarshall IslandsMauritaniaMauritiusMexicoMicronesia, Fed. Sts.Middle East & North AfricaMiddle East & North Africa (excluding high income)Middle East & North Africa (IDA & IBRD countries)Middle incomeMoldovaMonacoMongoliaMontenegroMoroccoMozambiqueMyanmarNamibiaNauruNepalNetherlandsNew CaledoniaNew ZealandNicaraguaNigerNigeriaNorth AmericaNorwayOECD membersOmanOther small statesPacific island small statesPakistanPalauPanamaPapua New GuineaParaguayPeruPhilippinesPolandPortugalPost-demographic dividendPre-demographic dividendPuerto RicoQatarRomaniaRussian FederationRwandaSamoaSan MarinoSao Tome and PrincipeSaudi ArabiaSenegalSerbiaSeychellesSierra LeoneSingaporeSlovak RepublicSloveniaSmall statesSolomon IslandsSomaliaSouth AfricaSouth AsiaSouth Asia (IDA & IBRD)South SudanSpainSri LankaSt. Kitts and NevisSt. LuciaSt. Vincent and the GrenadinesSub-Saharan Africa Sub-Saharan Africa (excluding high income)Sub-Saharan Africa (IDA & IBRD countries)SudanSurinameSwazilandSwedenSwitzerlandSyrian Arab RepublicTajikistanTanzaniaThailandTimor-LesteTogoTongaTrinidad and TobagoTunisiaTurkeyTurkmenistanTuvaluUgandaUkraineUnited Arab EmiratesUnited KingdomUnited StatesUpper middle incomeUruguayUzbekistanVanuatuVenezuela, RBVietnamVirgin Islands (U.S.)West Bank and GazaWorldYemen, Rep.ZambiaZimbabwe Linha do tempo:
Nesta escala de tempo está apresentado um gráfico de 1962 ano até 2016 ano Colombia. Dados de 1961 ano ausente. O número de observações reais por data: 55.
Fonte (nome):
Indicadores de desenvolvimento mundial
Fonte (organização):
World Bank national accounts data, and OECD National Accounts data files.
Categorias:
Economy & Growth
Foi atualizado:
23 abr 2017 ano
Indicadores de alterações dos valores ao longo dos anos
Mínimo:
-4.204
1 jan 2000 ano
Máximo:
8.463
1 jan 1979 ano
Na data de observação
Valor
Mudança absoluta
A alteração em relação ao valor anterior
1 jan 1962 ano
5.265
+5.265
0.0%
1 jan 1963 ano
5.467
+0.201
3.82%
1 jan 1964 ano
2.904
-2.562
-46.87%
1 jan 1965 ano
6.602
+3.698
127.34%
1 jan 1966 ano
3.012
-3.59
-54.37%
1 jan 1967 ano
5.322
+2.31
76.68%
1 jan 1968 ano
4.191
-1.132
-21.26%
1 jan 1969 ano
6.427
+2.237
53.38%
1 jan 1970 ano
6.521
+0.093
1.45%
1 jan 1971 ano
6.957
+0.436
6.68%
1 jan 1972 ano
5.951
-1.005
-14.45%
1 jan 1973 ano
7.673
+1.722
28.94%
1 jan 1974 ano
6.727
-0.946
-12.33%
1 jan 1975 ano
5.743
-0.985
-14.64%
1 jan 1976 ano
2.248
-3.494
-60.85%
1 jan 1977 ano
4.817
+2.569
114.28%
1 jan 1978 ano
4.148
-0.669
-13.89%
1 jan 1979 ano
8.463
+4.315
104.04%
1 jan 1980 ano
5.383
-3.081
-36.4%
1 jan 1981 ano
4.098
-1.285
-23.87%
1 jan 1982 ano
2.263
-1.835
-44.78%
1 jan 1983 ano
0.948
-1.315
-58.09%
1 jan 1984 ano
1.584
+0.636
67.04%
1 jan 1985 ano
3.355
+1.771
111.76%
1 jan 1986 ano
3.088
-0.267
-7.95%
1 jan 1987 ano
5.838
+2.75
89.05%
1 jan 1988 ano
5.372
-0.467
-8.0%
1 jan 1989 ano
4.06
-1.312
-24.42%
1 jan 1990 ano
3.417
-0.642
-15.82%
1 jan 1991 ano
6.042
+2.625
76.8%
1 jan 1992 ano
2.277
-3.765
-62.31%
1 jan 1993 ano
5.033
+2.755
121.0%
1 jan 1994 ano
2.366
-2.667
-52.99%
1 jan 1995 ano
5.836
+3.47
146.69%
1 jan 1996 ano
5.202
-0.633
-10.85%
1 jan 1997 ano
2.056
-3.147
-60.48%
1 jan 1998 ano
3.43
+1.374
66.85%
1 jan 1999 ano
0.57
-2.861
-83.39%
1 jan 2000 ano
-4.204
-4.774
-837.83%
1 jan 2001 ano
4.42
+8.624
-205.14%
1 jan 2002 ano
1.678
-2.742
-62.04%
1 jan 2003 ano
2.504
+0.826
49.23%
1 jan 2004 ano
3.918
+1.414
56.48%
1 jan 2005 ano
5.333
+1.415
36.11%
1 jan 2006 ano
4.707
-0.626
-11.75%
1 jan 2007 ano
6.698
+1.991
42.3%
1 jan 2008 ano
6.901
+0.203
3.03%
1 jan 2009 ano
3.547
-3.354
-48.6%
1 jan 2010 ano
1.652
-1.895
-53.44%
1 jan 2011 ano
3.972
+2.32
140.49%
1 jan 2012 ano
6.59
+2.618
65.91%
1 jan 2013 ano
4.044
-2.546
-38.63%
1 jan 2014 ano
4.874
+0.83
20.53%
1 jan 2015 ano
4.386
-0.488
-10.02%
1 jan 2016 ano
3.083
-1.302
-29.7%
Classificação de países por estatísticas atuais por anos


Comentários: