29
/pt/
pt
AIzaSyAYiBZKx7MnpbEhh9jyipgxe19OcubqV5w
April 1, 2024
193023
Mauritania
MRT
true
2
1
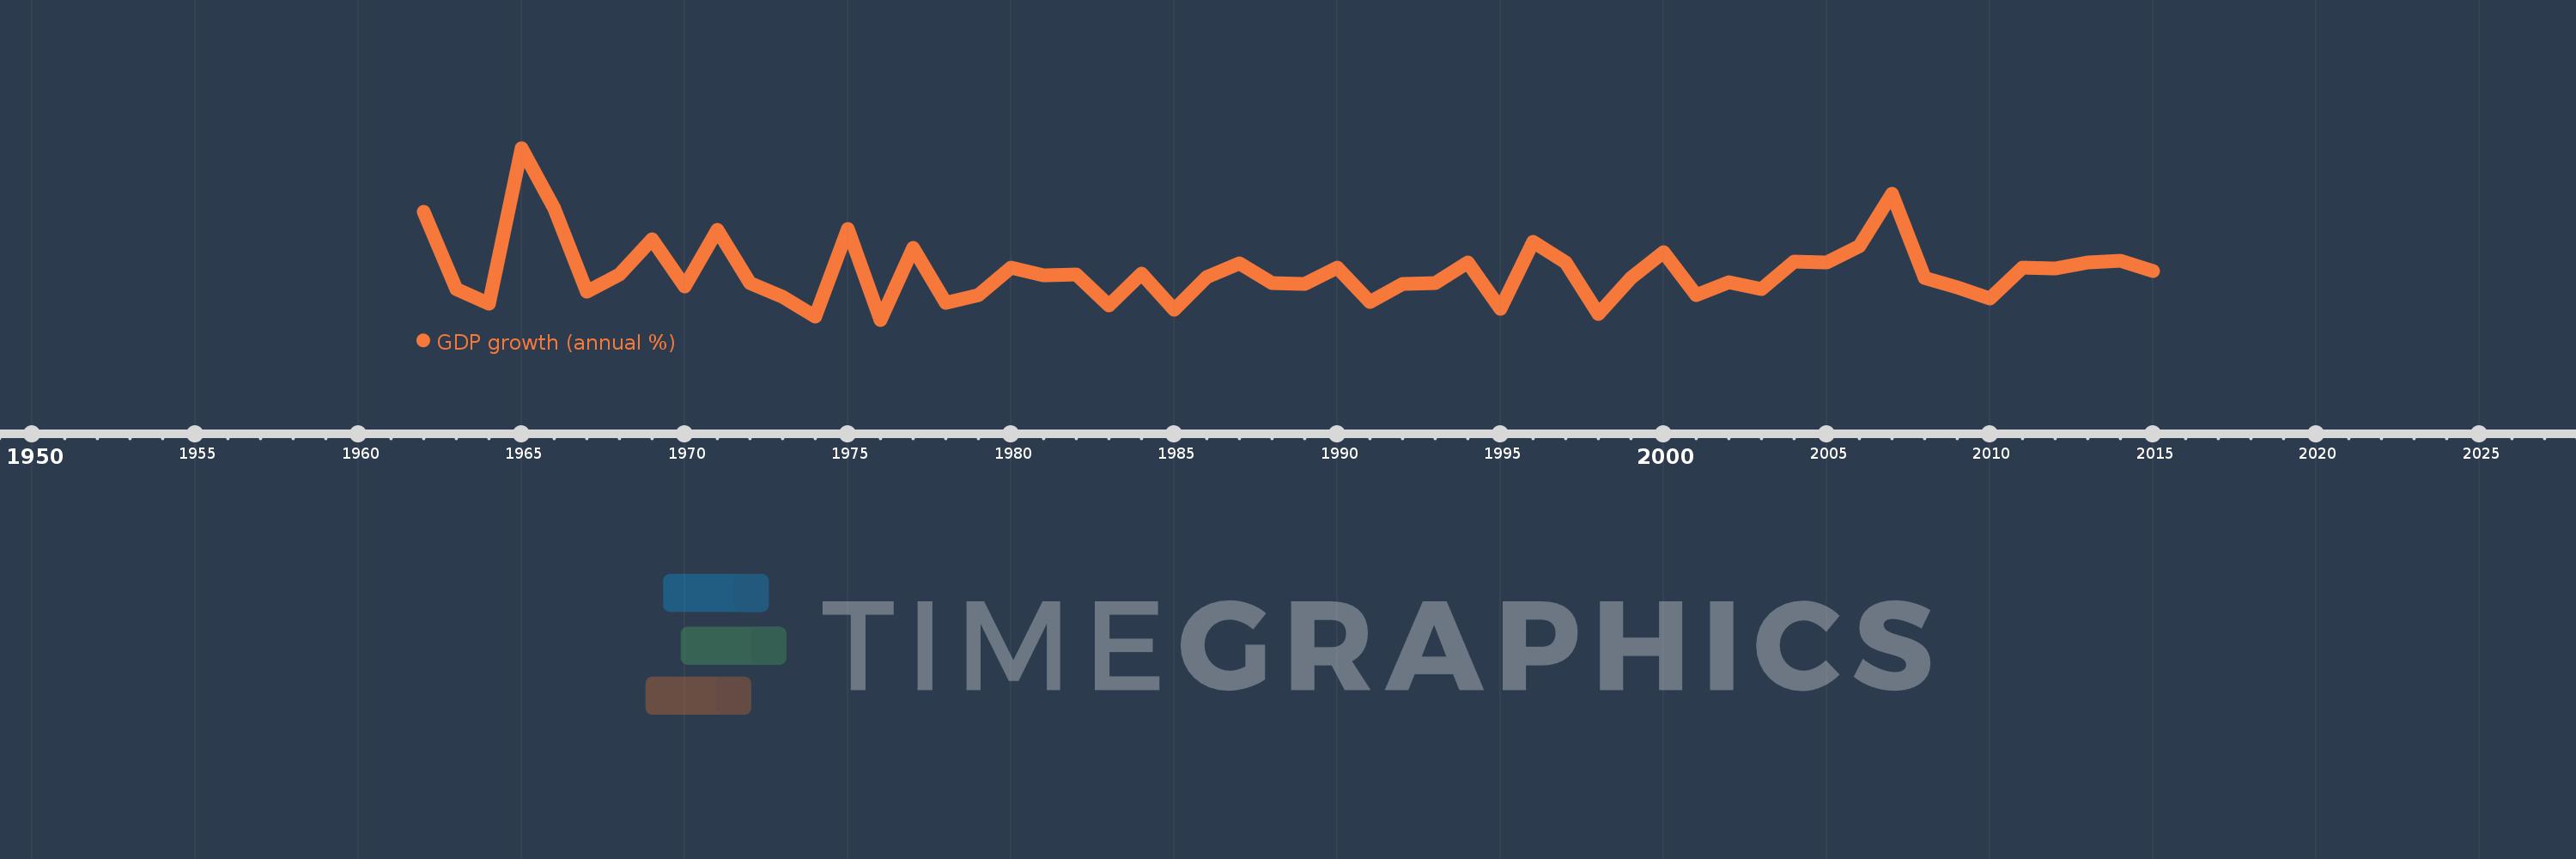
GDP growth (annual %)
2015,2014,2013,2012,2011,2010,2009,2008,2007,2006,2005,2004,2003,2002,2001,2000,1999,1998,1997,1996,1995,1994,1993,1992,1991,1990,1989,1988,1987,1986,1985,1984,1983,1982,1981,1980,1979,1978,1977,1976,1975,1974,1973,1972,1971,1970,1969,1968,1967,1966,1965,1964,1963,1962
Estas estatísticas em outros países:
AfghanistanAlbaniaAlgeriaAndorraAngolaAntigua and BarbudaArab WorldArgentinaArmeniaArubaAustraliaAustriaAzerbaijanBahamas, TheBahrainBangladeshBarbadosBelarusBelgiumBelizeBeninBermudaBhutanBoliviaBosnia and HerzegovinaBotswanaBrazilBrunei DarussalamBulgariaBurkina FasoBurundiCabo VerdeCambodiaCameroonCanadaCaribbean small statesCayman IslandsCentral African RepublicCentral Europe and the BalticsChadChannel IslandsChileChinaColombiaComorosCongo, Dem. Rep.Congo, Rep.Costa RicaCote d'IvoireCroatiaCubaCyprusCzech RepublicDenmarkDjiboutiDominicaDominican RepublicEarly-demographic dividendEast Asia & PacificEast Asia & Pacific (excluding high income)East Asia & Pacific (IDA & IBRD countries)EcuadorEgypt, Arab Rep.El SalvadorEquatorial GuineaEritreaEstoniaEthiopiaEuro areaEurope & Central AsiaEurope & Central Asia (excluding high income)Europe & Central Asia (IDA & IBRD countries)European UnionFijiFinlandFragile and conflict affected situationsFranceFrench PolynesiaGabonGambia, TheGeorgiaGermanyGhanaGreeceGreenlandGrenadaGuatemalaGuineaGuinea-BissauGuyanaHaitiHeavily indebted poor countries (HIPC)High incomeHondurasHong Kong SAR, ChinaHungaryIBRD onlyIcelandIDA & IBRD totalIDA blendIDA onlyIDA totalIndiaIndonesiaIran, Islamic Rep.IraqIrelandIsle of ManIsraelItalyJamaicaJapanJordanKazakhstanKenyaKiribatiKorea, Rep.KosovoKuwaitKyrgyz RepublicLao PDRLate-demographic dividendLatin America & Caribbean Latin America & Caribbean (excluding high income)Latin America & the Caribbean (IDA & IBRD countries)LatviaLeast developed countries: UN classificationLebanonLesothoLiberiaLibyaLiechtensteinLithuaniaLow & middle incomeLow incomeLower middle incomeLuxembourgMacao SAR, ChinaMacedonia, FYRMadagascarMalawiMalaysiaMaldivesMaliMaltaMarshall IslandsMauritaniaMauritiusMexicoMicronesia, Fed. Sts.Middle East & North AfricaMiddle East & North Africa (excluding high income)Middle East & North Africa (IDA & IBRD countries)Middle incomeMoldovaMonacoMongoliaMontenegroMoroccoMozambiqueMyanmarNamibiaNauruNepalNetherlandsNew CaledoniaNew ZealandNicaraguaNigerNigeriaNorth AmericaNorwayOECD membersOmanOther small statesPacific island small statesPakistanPalauPanamaPapua New GuineaParaguayPeruPhilippinesPolandPortugalPost-demographic dividendPre-demographic dividendPuerto RicoQatarRomaniaRussian FederationRwandaSamoaSan MarinoSao Tome and PrincipeSaudi ArabiaSenegalSerbiaSeychellesSierra LeoneSingaporeSlovak RepublicSloveniaSmall statesSolomon IslandsSomaliaSouth AfricaSouth AsiaSouth Asia (IDA & IBRD)South SudanSpainSri LankaSt. Kitts and NevisSt. LuciaSt. Vincent and the GrenadinesSub-Saharan Africa Sub-Saharan Africa (excluding high income)Sub-Saharan Africa (IDA & IBRD countries)SudanSurinameSwazilandSwedenSwitzerlandSyrian Arab RepublicTajikistanTanzaniaThailandTimor-LesteTogoTongaTrinidad and TobagoTunisiaTurkeyTurkmenistanTuvaluUgandaUkraineUnited Arab EmiratesUnited KingdomUnited StatesUpper middle incomeUruguayUzbekistanVanuatuVenezuela, RBVietnamVirgin Islands (U.S.)West Bank and GazaWorldYemen, Rep.ZambiaZimbabwe Linha do tempo:
Nesta escala de tempo está apresentado um gráfico de 1962 ano até 2015 ano Mauritania. Dados de 1961 ano ausente. O número de observações reais por data: 54.
Fonte (nome):
Indicadores de desenvolvimento mundial
Fonte (organização):
World Bank national accounts data, and OECD National Accounts data files.
Categorias:
Economy & Growth
Foi atualizado:
23 abr 2017 ano
Indicadores de alterações dos valores ao longo dos anos
Mínimo:
-5.134
1 jan 1976 ano
Máximo:
27.691
1 jan 1965 ano
Na data de observação
Valor
Mudança absoluta
A alteração em relação ao valor anterior
1 jan 1962 ano
15.53
+15.53
0.0%
1 jan 1963 ano
0.727
-14.803
-95.32%
1 jan 1964 ano
-1.984
-2.71
-373.02%
1 jan 1965 ano
27.691
+29.675
-1.5 mil%
1 jan 1966 ano
16.138
-11.553
-41.72%
1 jan 1967 ano
0.231
-15.907
-98.57%
1 jan 1968 ano
3.567
+3.336
1.44 mil%
1 jan 1969 ano
10.196
+6.629
185.84%
1 jan 1970 ano
1.249
-8.948
-87.76%
1 jan 1971 ano
11.986
+10.737
860.0%
1 jan 1972 ano
1.843
-10.143
-84.62%
1 jan 1973 ano
-0.733
-2.576
-139.77%
1 jan 1974 ano
-4.585
-3.852
525.56%
1 jan 1975 ano
12.163
+16.747
-365.28%
1 jan 1976 ano
-5.134
-17.297
-142.21%
1 jan 1977 ano
8.546
+13.68
-266.45%
1 jan 1978 ano
-1.879
-10.425
-121.98%
1 jan 1979 ano
-0.505
+1.374
-73.13%
1 jan 1980 ano
4.79
+5.295
-1.05 mil%
1 jan 1981 ano
3.371
-1.419
-29.62%
1 jan 1982 ano
3.45
+0.079
2.35%
1 jan 1983 ano
-2.34
-5.79
-167.82%
1 jan 1984 ano
3.735
+6.075
-259.64%
1 jan 1985 ano
-3.227
-6.962
-186.39%
1 jan 1986 ano
2.995
+6.222
-192.81%
1 jan 1987 ano
5.714
+2.719
90.79%
1 jan 1988 ano
1.9
-3.813
-66.74%
1 jan 1989 ano
1.72
-0.18
-9.47%
1 jan 1990 ano
4.778
+3.057
177.7%
1 jan 1991 ano
-1.771
-6.549
-137.08%
1 jan 1992 ano
1.788
+3.559
-200.95%
1 jan 1993 ano
1.874
+0.086
4.81%
1 jan 1994 ano
5.874
+4.0
213.41%
1 jan 1995 ano
-3.061
-8.934
-152.11%
1 jan 1996 ano
9.82
+12.881
-420.83%
1 jan 1997 ano
5.819
-4.001
-40.74%
1 jan 1998 ano
-4.045
-9.864
-169.51%
1 jan 1999 ano
2.778
+6.823
-168.68%
1 jan 2000 ano
7.713
+4.935
177.66%
1 jan 2001 ano
-0.43
-8.143
-105.58%
1 jan 2002 ano
2.009
+2.439
-566.72%
1 jan 2003 ano
0.665
-1.344
-66.9%
1 jan 2004 ano
5.978
+5.313
798.98%
1 jan 2005 ano
5.747
-0.231
-3.86%
1 jan 2006 ano
8.969
+3.222
56.06%
1 jan 2007 ano
18.869
+9.9
110.37%
1 jan 2008 ano
2.818
-16.051
-85.07%
1 jan 2009 ano
1.08
-1.738
-61.67%
1 jan 2010 ano
-1.042
-2.122
-196.49%
1 jan 2011 ano
4.774
+5.816
-558.09%
1 jan 2012 ano
4.704
-0.07
-1.46%
1 jan 2013 ano
5.795
+1.091
23.19%
1 jan 2014 ano
6.09
+0.295
5.09%
1 jan 2015 ano
4.206
-1.884
-30.94%
Classificação de países por estatísticas atuais por anos


Comentários: