29
/pt/
pt
AIzaSyAYiBZKx7MnpbEhh9jyipgxe19OcubqV5w
April 1, 2024
212956
Nigeria
NGA
true
2
1
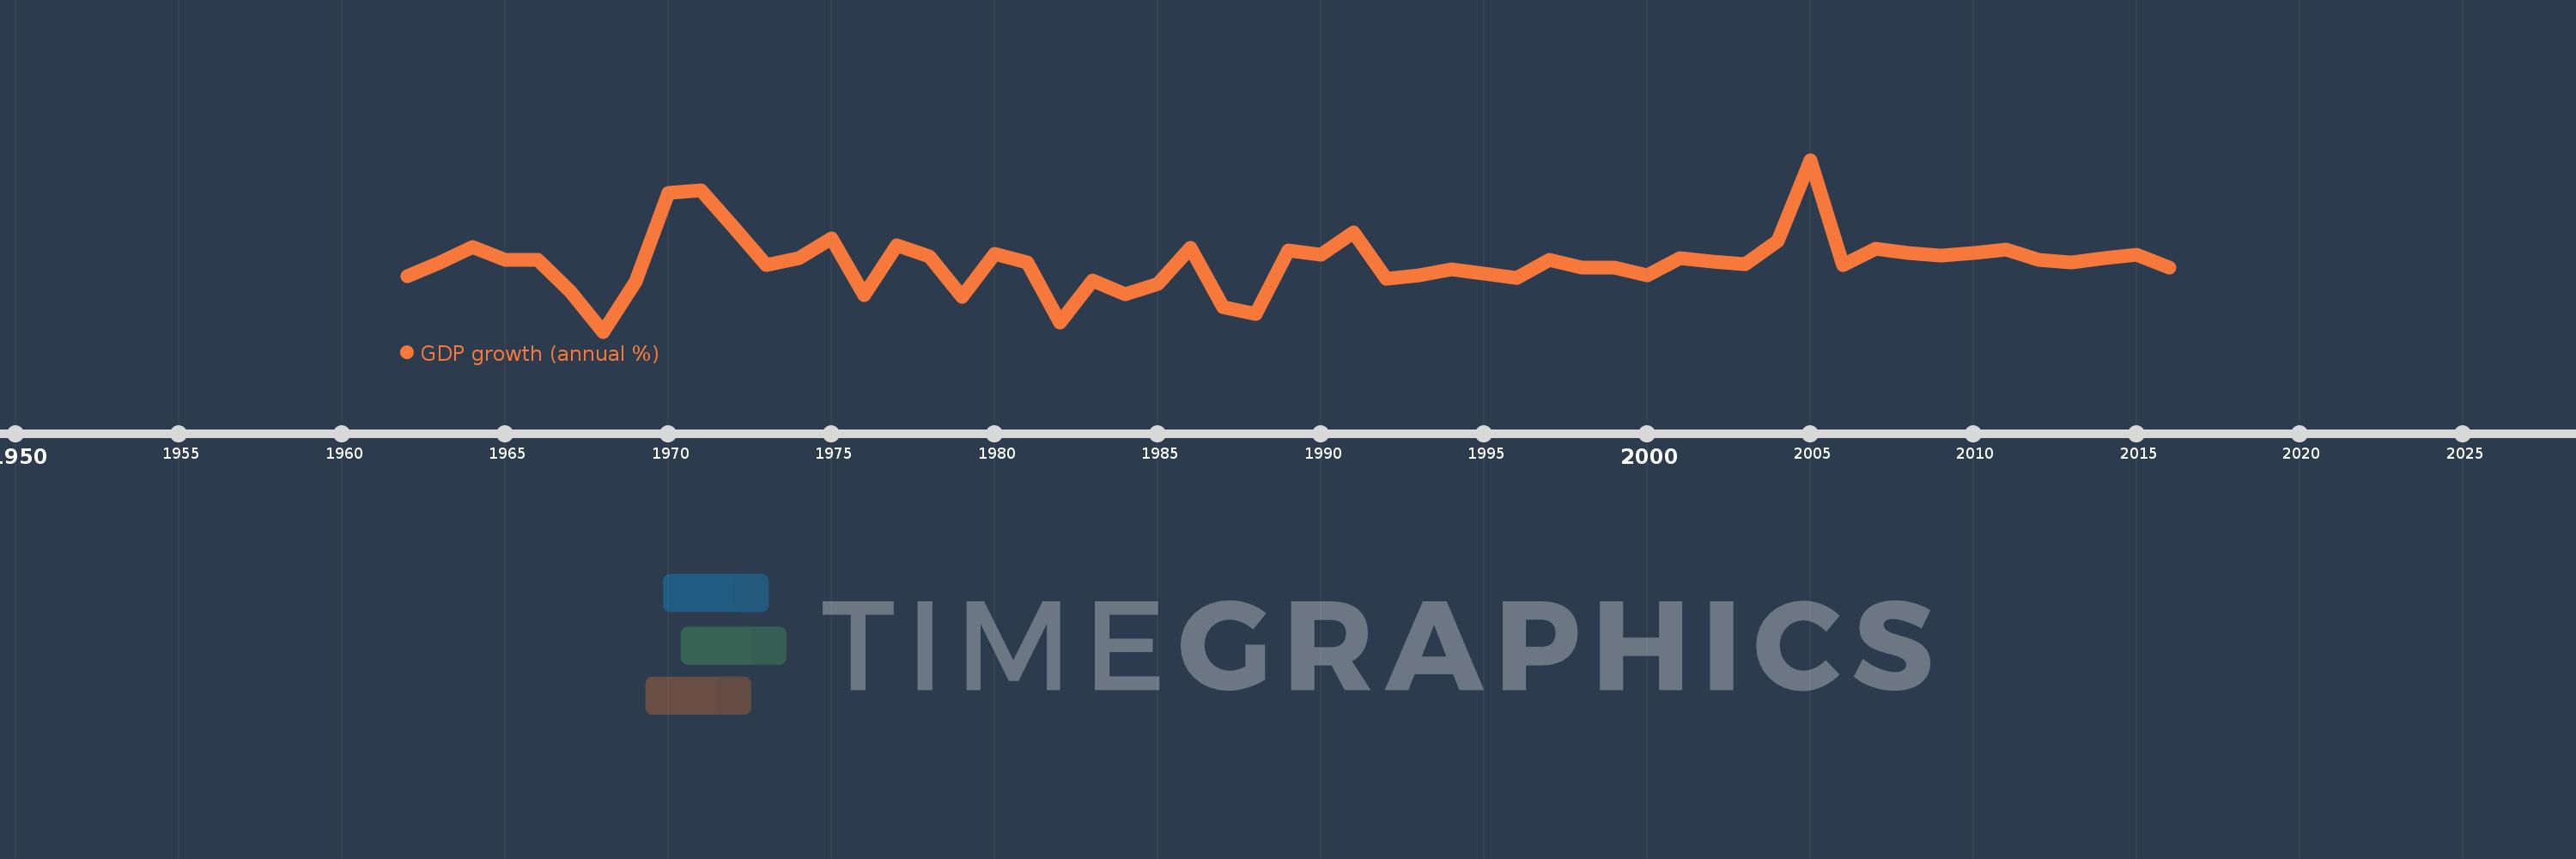
GDP growth (annual %)
2016,2015,2014,2013,2012,2011,2010,2009,2008,2007,2006,2005,2004,2003,2002,2001,2000,1999,1998,1997,1996,1995,1994,1993,1992,1991,1990,1989,1988,1987,1986,1985,1984,1983,1982,1981,1980,1979,1978,1977,1976,1975,1974,1973,1972,1971,1970,1969,1968,1967,1966,1965,1964,1963,1962
Estas estatísticas em outros países:
AfghanistanAlbaniaAlgeriaAndorraAngolaAntigua and BarbudaArab WorldArgentinaArmeniaArubaAustraliaAustriaAzerbaijanBahamas, TheBahrainBangladeshBarbadosBelarusBelgiumBelizeBeninBermudaBhutanBoliviaBosnia and HerzegovinaBotswanaBrazilBrunei DarussalamBulgariaBurkina FasoBurundiCabo VerdeCambodiaCameroonCanadaCaribbean small statesCayman IslandsCentral African RepublicCentral Europe and the BalticsChadChannel IslandsChileChinaColombiaComorosCongo, Dem. Rep.Congo, Rep.Costa RicaCote d'IvoireCroatiaCubaCyprusCzech RepublicDenmarkDjiboutiDominicaDominican RepublicEarly-demographic dividendEast Asia & PacificEast Asia & Pacific (excluding high income)East Asia & Pacific (IDA & IBRD countries)EcuadorEgypt, Arab Rep.El SalvadorEquatorial GuineaEritreaEstoniaEthiopiaEuro areaEurope & Central AsiaEurope & Central Asia (excluding high income)Europe & Central Asia (IDA & IBRD countries)European UnionFijiFinlandFragile and conflict affected situationsFranceFrench PolynesiaGabonGambia, TheGeorgiaGermanyGhanaGreeceGreenlandGrenadaGuatemalaGuineaGuinea-BissauGuyanaHaitiHeavily indebted poor countries (HIPC)High incomeHondurasHong Kong SAR, ChinaHungaryIBRD onlyIcelandIDA & IBRD totalIDA blendIDA onlyIDA totalIndiaIndonesiaIran, Islamic Rep.IraqIrelandIsle of ManIsraelItalyJamaicaJapanJordanKazakhstanKenyaKiribatiKorea, Rep.KosovoKuwaitKyrgyz RepublicLao PDRLate-demographic dividendLatin America & Caribbean Latin America & Caribbean (excluding high income)Latin America & the Caribbean (IDA & IBRD countries)LatviaLeast developed countries: UN classificationLebanonLesothoLiberiaLibyaLiechtensteinLithuaniaLow & middle incomeLow incomeLower middle incomeLuxembourgMacao SAR, ChinaMacedonia, FYRMadagascarMalawiMalaysiaMaldivesMaliMaltaMarshall IslandsMauritaniaMauritiusMexicoMicronesia, Fed. Sts.Middle East & North AfricaMiddle East & North Africa (excluding high income)Middle East & North Africa (IDA & IBRD countries)Middle incomeMoldovaMonacoMongoliaMontenegroMoroccoMozambiqueMyanmarNamibiaNauruNepalNetherlandsNew CaledoniaNew ZealandNicaraguaNigerNigeriaNorth AmericaNorwayOECD membersOmanOther small statesPacific island small statesPakistanPalauPanamaPapua New GuineaParaguayPeruPhilippinesPolandPortugalPost-demographic dividendPre-demographic dividendPuerto RicoQatarRomaniaRussian FederationRwandaSamoaSan MarinoSao Tome and PrincipeSaudi ArabiaSenegalSerbiaSeychellesSierra LeoneSingaporeSlovak RepublicSloveniaSmall statesSolomon IslandsSomaliaSouth AfricaSouth AsiaSouth Asia (IDA & IBRD)South SudanSpainSri LankaSt. Kitts and NevisSt. LuciaSt. Vincent and the GrenadinesSub-Saharan Africa Sub-Saharan Africa (excluding high income)Sub-Saharan Africa (IDA & IBRD countries)SudanSurinameSwazilandSwedenSwitzerlandSyrian Arab RepublicTajikistanTanzaniaThailandTimor-LesteTogoTongaTrinidad and TobagoTunisiaTurkeyTurkmenistanTuvaluUgandaUkraineUnited Arab EmiratesUnited KingdomUnited StatesUpper middle incomeUruguayUzbekistanVanuatuVenezuela, RBVietnamVirgin Islands (U.S.)West Bank and GazaWorldYemen, Rep.ZambiaZimbabwe Linha do tempo:
Nesta escala de tempo está apresentado um gráfico de 1962 ano até 2016 ano Nigeria. Dados de 1961 ano ausente. O número de observações reais por data: 55.
Fonte (nome):
Indicadores de desenvolvimento mundial
Fonte (organização):
World Bank national accounts data, and OECD National Accounts data files.
Categorias:
Economy & Growth
Foi atualizado:
23 abr 2017 ano
Indicadores de alterações dos valores ao longo dos anos
Mínimo:
-15.744
1 jan 1968 ano
Máximo:
33.736
1 jan 2005 ano
Na data de observação
Valor
Mudança absoluta
A alteração em relação ao valor anterior
1 jan 1962 ano
0.192
+0.192
0.0%
1 jan 1963 ano
4.103
+3.911
2.04 mil%
1 jan 1964 ano
8.579
+4.476
109.08%
1 jan 1965 ano
4.95
-3.628
-42.29%
1 jan 1966 ano
4.885
-0.066
-1.32%
1 jan 1967 ano
-4.251
-9.135
-187.01%
1 jan 1968 ano
-15.744
-11.493
270.39%
1 jan 1969 ano
-1.248
+14.495
-92.07%
1 jan 1970 ano
24.197
+25.446
-2.04 mil%
1 jan 1971 ano
25.007
+0.81
3.35%
1 jan 1972 ano
14.238
-10.77
-43.07%
1 jan 1973 ano
3.364
-10.873
-76.37%
1 jan 1974 ano
5.393
+2.028
60.3%
1 jan 1975 ano
11.161
+5.768
106.96%
1 jan 1976 ano
-5.228
-16.388
-146.84%
1 jan 1977 ano
9.042
+14.27
-272.97%
1 jan 1978 ano
6.024
-3.018
-33.38%
1 jan 1979 ano
-5.764
-11.788
-195.68%
1 jan 1980 ano
6.759
+12.524
-217.27%
1 jan 1981 ano
4.205
-2.555
-37.79%
1 jan 1982 ano
-13.128
-17.333
-412.21%
1 jan 1983 ano
-1.053
+12.075
-91.98%
1 jan 1984 ano
-5.05
-3.997
379.54%
1 jan 1985 ano
-2.022
+3.029
-59.97%
1 jan 1986 ano
8.323
+10.344
-511.71%
1 jan 1987 ano
-8.754
-17.077
-205.18%
1 jan 1988 ano
-10.752
-1.998
22.82%
1 jan 1989 ano
7.543
+18.294
-170.15%
1 jan 1990 ano
6.467
-1.075
-14.26%
1 jan 1991 ano
12.766
+6.299
97.4%
1 jan 1992 ano
-0.618
-13.384
-104.84%
1 jan 1993 ano
0.434
+1.052
-170.2%
1 jan 1994 ano
2.09
+1.657
381.96%
1 jan 1995 ano
0.91
-1.181
-56.48%
1 jan 1996 ano
-0.307
-1.217
-133.8%
1 jan 1997 ano
4.994
+5.301
-1.72 mil%
1 jan 1998 ano
2.802
-2.191
-43.88%
1 jan 1999 ano
2.716
-0.087
-3.09%
1 jan 2000 ano
0.474
-2.241
-82.54%
1 jan 2001 ano
5.318
+4.844
1.02 mil%
1 jan 2002 ano
4.411
-0.907
-17.06%
1 jan 2003 ano
3.785
-0.626
-14.2%
1 jan 2004 ano
10.354
+6.57
173.58%
1 jan 2005 ano
33.736
+23.382
225.82%
1 jan 2006 ano
3.445
-30.291
-89.79%
1 jan 2007 ano
8.211
+4.766
138.37%
1 jan 2008 ano
6.828
-1.383
-16.84%
1 jan 2009 ano
6.27
-0.558
-8.17%
1 jan 2010 ano
6.934
+0.664
10.59%
1 jan 2011 ano
7.84
+0.905
13.06%
1 jan 2012 ano
4.887
-2.952
-37.66%
1 jan 2013 ano
4.279
-0.608
-12.44%
1 jan 2014 ano
5.394
+1.115
26.06%
1 jan 2015 ano
6.31
+0.915
16.97%
1 jan 2016 ano
2.653
-3.657
-57.96%
Classificação de países por estatísticas atuais por anos


Comentários: