29
/pt/
pt
AIzaSyAYiBZKx7MnpbEhh9jyipgxe19OcubqV5w
April 1, 2024
36567
IBRD only
IBD
false
2
1
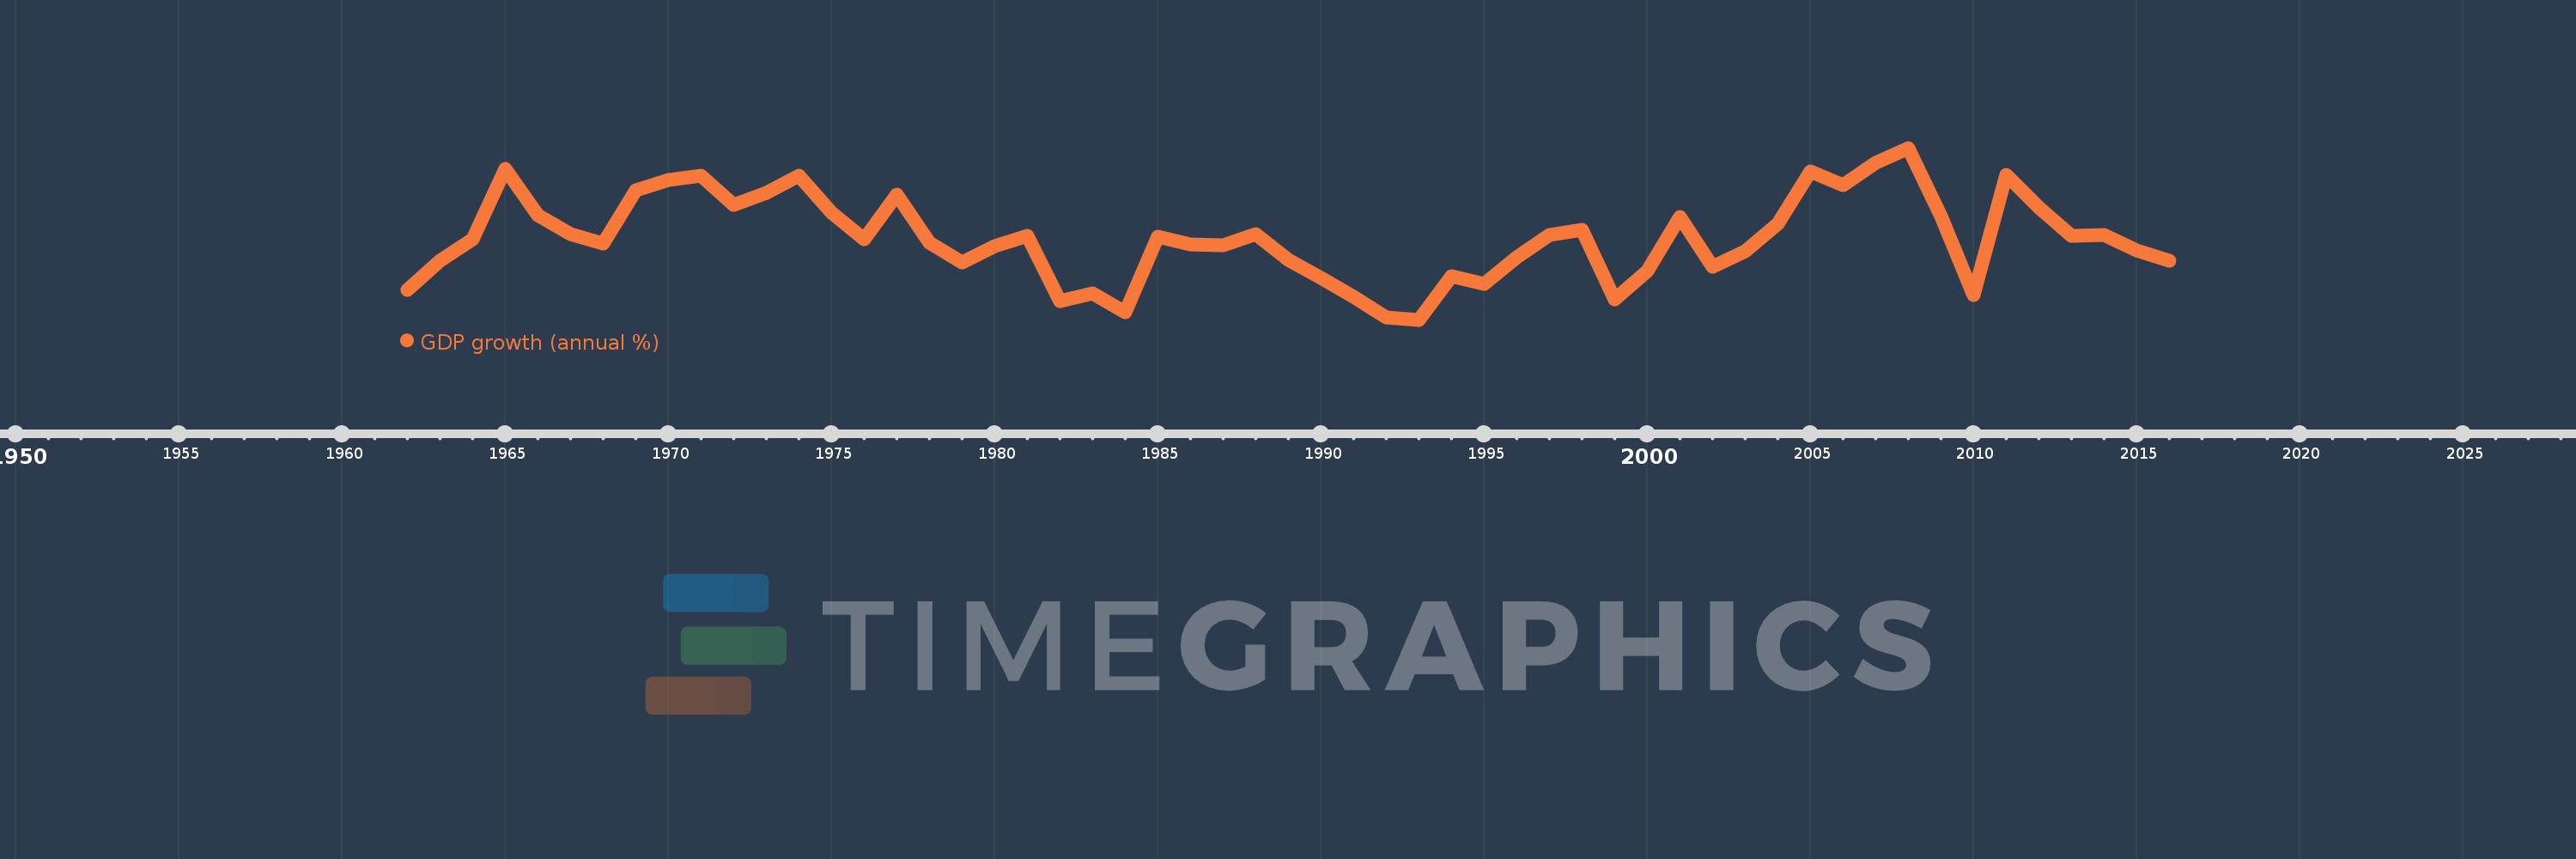
GDP growth (annual %)
2016,2015,2014,2013,2012,2011,2010,2009,2008,2007,2006,2005,2004,2003,2002,2001,2000,1999,1998,1997,1996,1995,1994,1993,1992,1991,1990,1989,1988,1987,1986,1985,1984,1983,1982,1981,1980,1979,1978,1977,1976,1975,1974,1973,1972,1971,1970,1969,1968,1967,1966,1965,1964,1963,1962
Estas estatísticas em outros países:
AfghanistanAlbaniaAlgeriaAndorraAngolaAntigua and BarbudaArab WorldArgentinaArmeniaArubaAustraliaAustriaAzerbaijanBahamas, TheBahrainBangladeshBarbadosBelarusBelgiumBelizeBeninBermudaBhutanBoliviaBosnia and HerzegovinaBotswanaBrazilBrunei DarussalamBulgariaBurkina FasoBurundiCabo VerdeCambodiaCameroonCanadaCaribbean small statesCayman IslandsCentral African RepublicCentral Europe and the BalticsChadChannel IslandsChileChinaColombiaComorosCongo, Dem. Rep.Congo, Rep.Costa RicaCote d'IvoireCroatiaCubaCyprusCzech RepublicDenmarkDjiboutiDominicaDominican RepublicEarly-demographic dividendEast Asia & PacificEast Asia & Pacific (excluding high income)East Asia & Pacific (IDA & IBRD countries)EcuadorEgypt, Arab Rep.El SalvadorEquatorial GuineaEritreaEstoniaEthiopiaEuro areaEurope & Central AsiaEurope & Central Asia (excluding high income)Europe & Central Asia (IDA & IBRD countries)European UnionFijiFinlandFragile and conflict affected situationsFranceFrench PolynesiaGabonGambia, TheGeorgiaGermanyGhanaGreeceGreenlandGrenadaGuatemalaGuineaGuinea-BissauGuyanaHaitiHeavily indebted poor countries (HIPC)High incomeHondurasHong Kong SAR, ChinaHungaryIBRD onlyIcelandIDA & IBRD totalIDA blendIDA onlyIDA totalIndiaIndonesiaIran, Islamic Rep.IraqIrelandIsle of ManIsraelItalyJamaicaJapanJordanKazakhstanKenyaKiribatiKorea, Rep.KosovoKuwaitKyrgyz RepublicLao PDRLate-demographic dividendLatin America & Caribbean Latin America & Caribbean (excluding high income)Latin America & the Caribbean (IDA & IBRD countries)LatviaLeast developed countries: UN classificationLebanonLesothoLiberiaLibyaLiechtensteinLithuaniaLow & middle incomeLow incomeLower middle incomeLuxembourgMacao SAR, ChinaMacedonia, FYRMadagascarMalawiMalaysiaMaldivesMaliMaltaMarshall IslandsMauritaniaMauritiusMexicoMicronesia, Fed. Sts.Middle East & North AfricaMiddle East & North Africa (excluding high income)Middle East & North Africa (IDA & IBRD countries)Middle incomeMoldovaMonacoMongoliaMontenegroMoroccoMozambiqueMyanmarNamibiaNauruNepalNetherlandsNew CaledoniaNew ZealandNicaraguaNigerNigeriaNorth AmericaNorwayOECD membersOmanOther small statesPacific island small statesPakistanPalauPanamaPapua New GuineaParaguayPeruPhilippinesPolandPortugalPost-demographic dividendPre-demographic dividendPuerto RicoQatarRomaniaRussian FederationRwandaSamoaSan MarinoSao Tome and PrincipeSaudi ArabiaSenegalSerbiaSeychellesSierra LeoneSingaporeSlovak RepublicSloveniaSmall statesSolomon IslandsSomaliaSouth AfricaSouth AsiaSouth Asia (IDA & IBRD)South SudanSpainSri LankaSt. Kitts and NevisSt. LuciaSt. Vincent and the GrenadinesSub-Saharan Africa Sub-Saharan Africa (excluding high income)Sub-Saharan Africa (IDA & IBRD countries)SudanSurinameSwazilandSwedenSwitzerlandSyrian Arab RepublicTajikistanTanzaniaThailandTimor-LesteTogoTongaTrinidad and TobagoTunisiaTurkeyTurkmenistanTuvaluUgandaUkraineUnited Arab EmiratesUnited KingdomUnited StatesUpper middle incomeUruguayUzbekistanVanuatuVenezuela, RBVietnamVirgin Islands (U.S.)West Bank and GazaWorldYemen, Rep.ZambiaZimbabwe Linha do tempo:
Nesta escala de tempo está apresentado um gráfico de 1962 ano até 2016 ano IBRD only. Dados de 1961 ano ausente. O número de observações reais por data: 55.
Fonte (nome):
Indicadores de desenvolvimento mundial
Fonte (organização):
World Bank national accounts data, and OECD National Accounts data files.
Categorias:
Economy & Growth
Foi atualizado:
23 abr 2017 ano
Indicadores de alterações dos valores ao longo dos anos
Mínimo:
0.974
1 jan 1993 ano
Máximo:
8.752
1 jan 2008 ano
Na data de observação
Valor
Mudança absoluta
A alteração em relação ao valor anterior
1 jan 1962 ano
2.312
+2.312
0.0%
1 jan 1963 ano
3.656
+1.343
58.08%
1 jan 1964 ano
4.617
+0.961
26.3%
1 jan 1965 ano
7.798
+3.181
68.89%
1 jan 1966 ano
5.691
-2.107
-27.02%
1 jan 1967 ano
4.855
-0.836
-14.69%
1 jan 1968 ano
4.429
-0.426
-8.77%
1 jan 1969 ano
6.831
+2.401
54.22%
1 jan 1970 ano
7.314
+0.484
7.08%
1 jan 1971 ano
7.497
+0.183
2.5%
1 jan 1972 ano
6.17
-1.327
-17.7%
1 jan 1973 ano
6.736
+0.566
9.17%
1 jan 1974 ano
7.487
+0.75
11.14%
1 jan 1975 ano
5.822
-1.665
-22.24%
1 jan 1976 ano
4.624
-1.198
-20.57%
1 jan 1977 ano
6.656
+2.032
43.94%
1 jan 1978 ano
4.449
-2.207
-33.16%
1 jan 1979 ano
3.561
-0.888
-19.95%
1 jan 1980 ano
4.294
+0.732
20.57%
1 jan 1981 ano
4.758
+0.465
10.82%
1 jan 1982 ano
1.817
-2.941
-61.81%
1 jan 1983 ano
2.159
+0.341
18.78%
1 jan 1984 ano
1.299
-0.859
-39.81%
1 jan 1985 ano
4.724
+3.425
263.6%
1 jan 1986 ano
4.385
-0.34
-7.19%
1 jan 1987 ano
4.355
-0.029
-0.67%
1 jan 1988 ano
4.843
+0.488
11.2%
1 jan 1989 ano
3.675
-1.169
-24.13%
1 jan 1990 ano
2.864
-0.811
-22.07%
1 jan 1991 ano
2.028
-0.836
-29.18%
1 jan 1992 ano
1.069
-0.959
-47.27%
1 jan 1993 ano
0.974
-0.095
-8.89%
1 jan 1994 ano
2.965
+1.99
204.32%
1 jan 1995 ano
2.602
-0.363
-12.23%
1 jan 1996 ano
3.786
+1.184
45.51%
1 jan 1997 ano
4.813
+1.027
27.12%
1 jan 1998 ano
5.046
+0.232
4.83%
1 jan 1999 ano
1.89
-3.156
-62.54%
1 jan 2000 ano
3.182
+1.292
68.37%
1 jan 2001 ano
5.64
+2.458
77.25%
1 jan 2002 ano
3.383
-2.258
-40.03%
1 jan 2003 ano
4.057
+0.674
19.93%
1 jan 2004 ano
5.337
+1.28
31.55%
1 jan 2005 ano
7.699
+2.362
44.27%
1 jan 2006 ano
7.054
-0.645
-8.38%
1 jan 2007 ano
8.077
+1.023
14.51%
1 jan 2008 ano
8.752
+0.674
8.35%
1 jan 2009 ano
5.653
-3.099
-35.41%
1 jan 2010 ano
2.096
-3.557
-62.92%
1 jan 2011 ano
7.517
+5.421
258.63%
1 jan 2012 ano
6.038
-1.479
-19.67%
1 jan 2013 ano
4.779
-1.259
-20.85%
1 jan 2014 ano
4.794
+0.015
0.3%
1 jan 2015 ano
4.13
-0.664
-13.85%
1 jan 2016 ano
3.647
-0.482
-11.68%
Classificação de países por estatísticas atuais por anos


Comentários: