29
/pt/
pt
AIzaSyAYiBZKx7MnpbEhh9jyipgxe19OcubqV5w
April 1, 2024
138018
Georgia
GEO
true
2
1
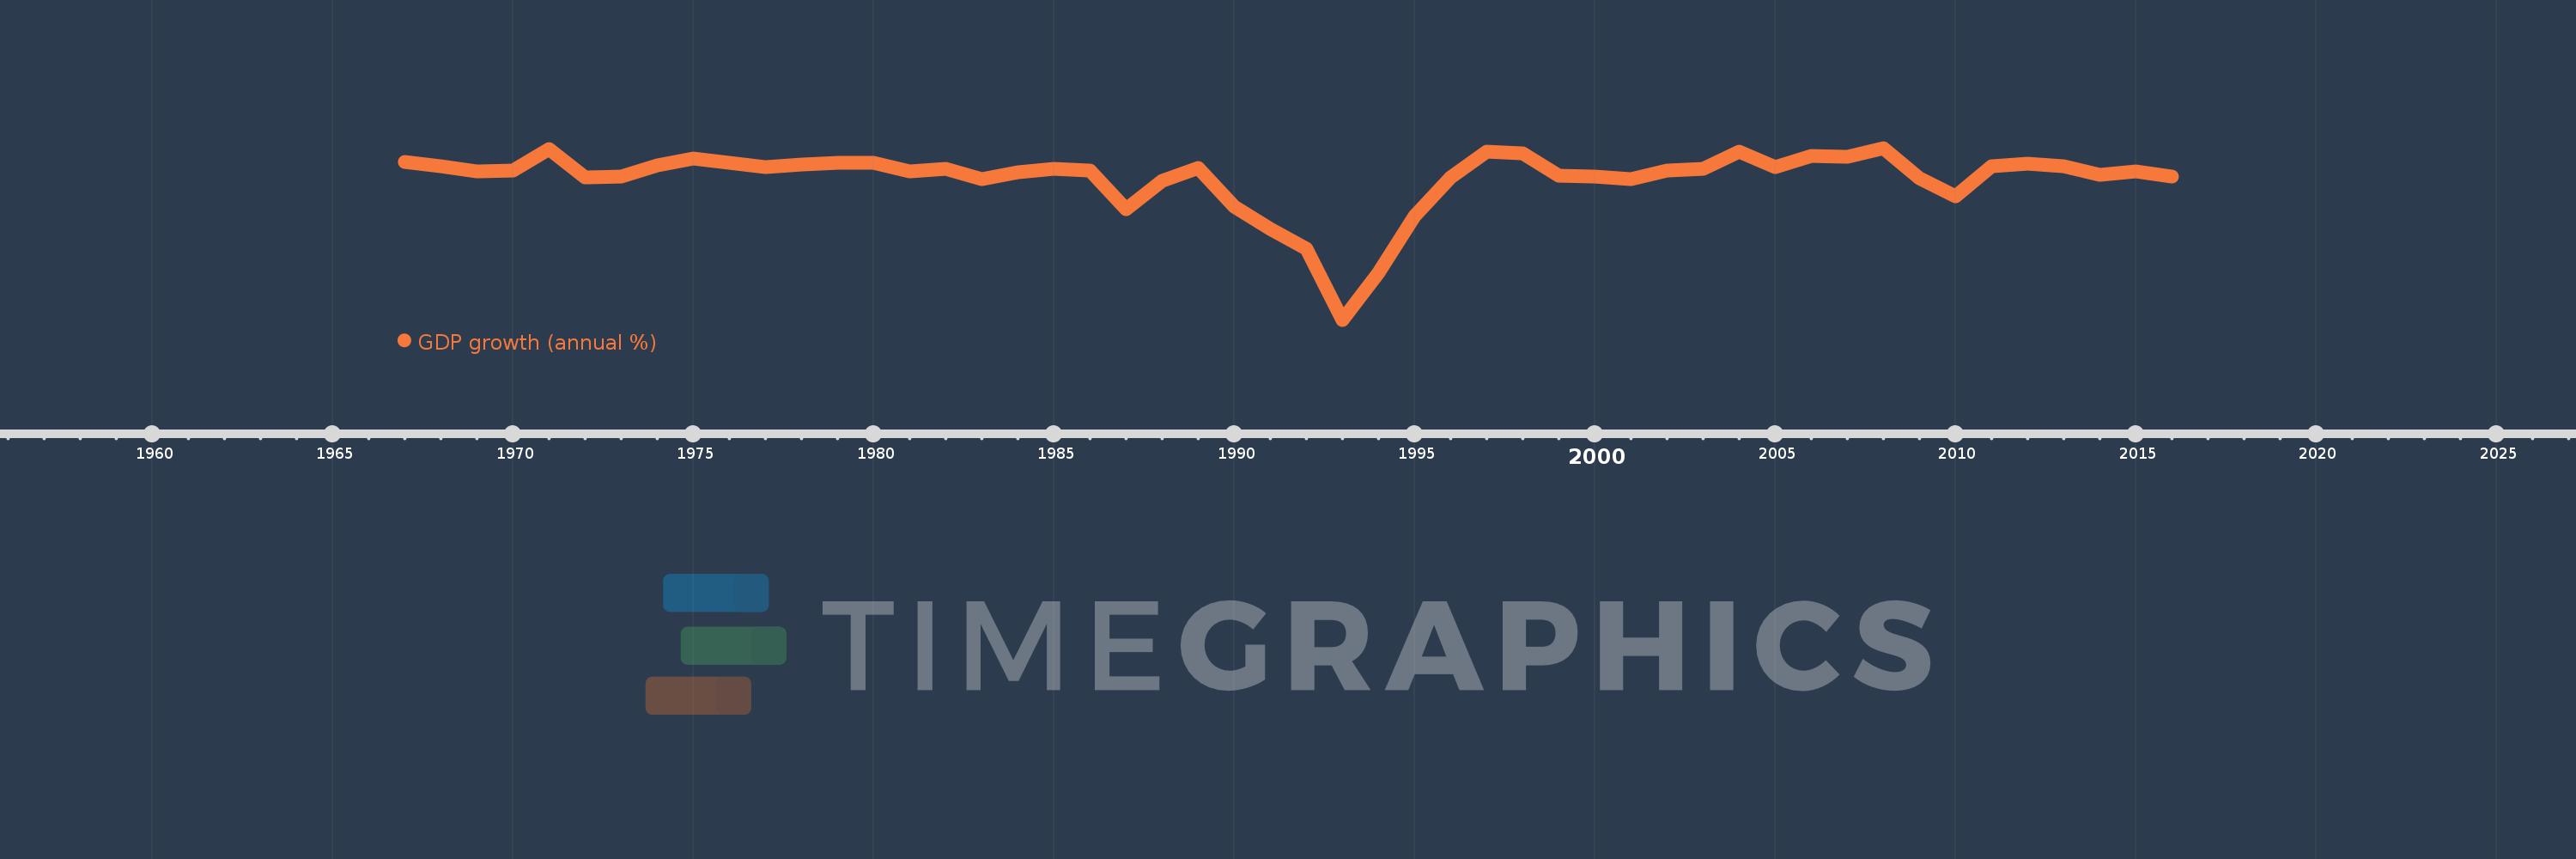
GDP growth (annual %)
2016,2015,2014,2013,2012,2011,2010,2009,2008,2007,2006,2005,2004,2003,2002,2001,2000,1999,1998,1997,1996,1995,1994,1993,1992,1991,1990,1989,1988,1987,1986,1985,1984,1983,1982,1981,1980,1979,1978,1977,1976,1975,1974,1973,1972,1971,1970,1969,1968,1967
Estas estatísticas em outros países:
AfghanistanAlbaniaAlgeriaAndorraAngolaAntigua and BarbudaArab WorldArgentinaArmeniaArubaAustraliaAustriaAzerbaijanBahamas, TheBahrainBangladeshBarbadosBelarusBelgiumBelizeBeninBermudaBhutanBoliviaBosnia and HerzegovinaBotswanaBrazilBrunei DarussalamBulgariaBurkina FasoBurundiCabo VerdeCambodiaCameroonCanadaCaribbean small statesCayman IslandsCentral African RepublicCentral Europe and the BalticsChadChannel IslandsChileChinaColombiaComorosCongo, Dem. Rep.Congo, Rep.Costa RicaCote d'IvoireCroatiaCubaCyprusCzech RepublicDenmarkDjiboutiDominicaDominican RepublicEarly-demographic dividendEast Asia & PacificEast Asia & Pacific (excluding high income)East Asia & Pacific (IDA & IBRD countries)EcuadorEgypt, Arab Rep.El SalvadorEquatorial GuineaEritreaEstoniaEthiopiaEuro areaEurope & Central AsiaEurope & Central Asia (excluding high income)Europe & Central Asia (IDA & IBRD countries)European UnionFijiFinlandFragile and conflict affected situationsFranceFrench PolynesiaGabonGambia, TheGeorgiaGermanyGhanaGreeceGreenlandGrenadaGuatemalaGuineaGuinea-BissauGuyanaHaitiHeavily indebted poor countries (HIPC)High incomeHondurasHong Kong SAR, ChinaHungaryIBRD onlyIcelandIDA & IBRD totalIDA blendIDA onlyIDA totalIndiaIndonesiaIran, Islamic Rep.IraqIrelandIsle of ManIsraelItalyJamaicaJapanJordanKazakhstanKenyaKiribatiKorea, Rep.KosovoKuwaitKyrgyz RepublicLao PDRLate-demographic dividendLatin America & Caribbean Latin America & Caribbean (excluding high income)Latin America & the Caribbean (IDA & IBRD countries)LatviaLeast developed countries: UN classificationLebanonLesothoLiberiaLibyaLiechtensteinLithuaniaLow & middle incomeLow incomeLower middle incomeLuxembourgMacao SAR, ChinaMacedonia, FYRMadagascarMalawiMalaysiaMaldivesMaliMaltaMarshall IslandsMauritaniaMauritiusMexicoMicronesia, Fed. Sts.Middle East & North AfricaMiddle East & North Africa (excluding high income)Middle East & North Africa (IDA & IBRD countries)Middle incomeMoldovaMonacoMongoliaMontenegroMoroccoMozambiqueMyanmarNamibiaNauruNepalNetherlandsNew CaledoniaNew ZealandNicaraguaNigerNigeriaNorth AmericaNorwayOECD membersOmanOther small statesPacific island small statesPakistanPalauPanamaPapua New GuineaParaguayPeruPhilippinesPolandPortugalPost-demographic dividendPre-demographic dividendPuerto RicoQatarRomaniaRussian FederationRwandaSamoaSan MarinoSao Tome and PrincipeSaudi ArabiaSenegalSerbiaSeychellesSierra LeoneSingaporeSlovak RepublicSloveniaSmall statesSolomon IslandsSomaliaSouth AfricaSouth AsiaSouth Asia (IDA & IBRD)South SudanSpainSri LankaSt. Kitts and NevisSt. LuciaSt. Vincent and the GrenadinesSub-Saharan Africa Sub-Saharan Africa (excluding high income)Sub-Saharan Africa (IDA & IBRD countries)SudanSurinameSwazilandSwedenSwitzerlandSyrian Arab RepublicTajikistanTanzaniaThailandTimor-LesteTogoTongaTrinidad and TobagoTunisiaTurkeyTurkmenistanTuvaluUgandaUkraineUnited Arab EmiratesUnited KingdomUnited StatesUpper middle incomeUruguayUzbekistanVanuatuVenezuela, RBVietnamVirgin Islands (U.S.)West Bank and GazaWorldYemen, Rep.ZambiaZimbabwe Linha do tempo:
Nesta escala de tempo está apresentado um gráfico de 1967 ano até 2016 ano Georgia. Dados de 1966 ano ausente. O número de observações reais por data: 50.
Fonte (nome):
Indicadores de desenvolvimento mundial
Fonte (organização):
World Bank national accounts data, and OECD National Accounts data files.
Categorias:
Economy & Growth
Foi atualizado:
23 abr 2017 ano
Indicadores de alterações dos valores ao longo dos anos
Mínimo:
-44.9
1 jan 1993 ano
Máximo:
12.344
1 jan 2008 ano
Na data de observação
Valor
Mudança absoluta
A alteração em relação ao valor anterior
1 jan 1967 ano
7.536
+7.536
0.0%
1 jan 1968 ano
6.25
-1.286
-17.06%
1 jan 1969 ano
4.456
-1.794
-28.7%
1 jan 1970 ano
4.778
+0.322
7.22%
1 jan 1971 ano
12.052
+7.274
152.23%
1 jan 1972 ano
2.471
-9.581
-79.5%
1 jan 1973 ano
2.837
+0.366
14.81%
1 jan 1974 ano
6.483
+3.646
128.52%
1 jan 1975 ano
8.808
+2.326
35.87%
1 jan 1976 ano
7.381
-1.427
-16.2%
1 jan 1977 ano
6.098
-1.283
-17.39%
1 jan 1978 ano
6.897
+0.799
13.1%
1 jan 1979 ano
7.429
+0.533
7.72%
1 jan 1980 ano
7.37
-0.059
-0.79%
1 jan 1981 ano
4.576
-2.794
-37.91%
1 jan 1982 ano
5.267
+0.691
15.1%
1 jan 1983 ano
2.002
-3.266
-62.0%
1 jan 1984 ano
4.302
+2.3
114.93%
1 jan 1985 ano
5.427
+1.125
26.15%
1 jan 1986 ano
4.942
-0.485
-8.94%
1 jan 1987 ano
-8.175
-13.117
-265.44%
1 jan 1988 ano
1.282
+9.457
-115.68%
1 jan 1989 ano
5.556
+4.274
333.34%
1 jan 1990 ano
-7.195
-12.751
-229.51%
1 jan 1991 ano
-14.788
-7.593
105.53%
1 jan 1992 ano
-21.1
-6.312
42.68%
1 jan 1993 ano
-44.9
-23.8
112.8%
1 jan 1994 ano
-29.3
+15.6
-34.74%
1 jan 1995 ano
-10.4
+18.9
-64.51%
1 jan 1996 ano
2.6
+13.0
-125.0%
1 jan 1997 ano
11.2
+8.6
330.77%
1 jan 1998 ano
10.519
-0.681
-6.08%
1 jan 1999 ano
3.105
-7.414
-70.48%
1 jan 2000 ano
2.869
-0.236
-7.59%
1 jan 2001 ano
1.838
-1.031
-35.93%
1 jan 2002 ano
4.805
+2.967
161.4%
1 jan 2003 ano
5.474
+0.668
13.91%
1 jan 2004 ano
11.058
+5.584
102.02%
1 jan 2005 ano
5.857
-5.201
-47.03%
1 jan 2006 ano
9.6
+3.742
63.89%
1 jan 2007 ano
9.383
-0.216
-2.25%
1 jan 2008 ano
12.344
+2.961
31.55%
1 jan 2009 ano
2.314
-10.03
-81.25%
1 jan 2010 ano
-3.776
-6.09
-263.17%
1 jan 2011 ano
6.253
+10.029
-265.61%
1 jan 2012 ano
7.222
+0.968
15.49%
1 jan 2013 ano
6.35
-0.871
-12.06%
1 jan 2014 ano
3.387
-2.963
-46.66%
1 jan 2015 ano
4.623
+1.236
36.5%
1 jan 2016 ano
2.775
-1.848
-39.98%
Classificação de países por estatísticas atuais por anos


Comentários: